Houston Updates
-
Archive
- June 2025
- March 2025
- December 10, 2024
- September 14, 2024
- May 21, 2024
- March 19, 2024
- December 9, 2023
- June 16, 2023
- April 6, 2023
- March 17, 2023
- Dec. 19, 2022
- Sept. 14, 2022
- July 4, 2022
- March 27, 2022
- March 9, 2022
- September 2021
- April 2021
- March 2021
- September 2020
- August 2020
- June 2020
- April 2020
- March 2020
- January 2020
- December 2018
- June 2018
- March 2018
- February 2018
- January 2018
- September 2017
- September 2017 Post-Hurricane
- June 2017
- March 2017
- January 2017
- September 2016
- March 2016
- December 2015
- September 2015
- June 2015
- March 2015
- December 2014
- June 2014
- March 2014
- November 2013
- September 2013
Oil Picks Up the Pieces After Economic Shock: Recovery Now Begins for Oil Markets and Houston
August 9, 2020
This article is a detailed look at the recent and difficult times for Houston’s oil industry. A lynchpin of Houston’s economy, in the last few months local oil activity has shared the extraordinary reversals of American oil and lost 26,000 jobs. The oil price crash of 2015-16 left a local workforce substantially reduced in size, and a second downturn is now underway that began with serious credit problems and bankruptcies in 2019. That has been followed earlier this year by COVID-19 and the Saudi/Russian oil war. After a detailed look at recent events, the report draws the following conclusions.
- Evidence grows that a bottom has been found for U.S. oil-related activity, and that a moderate upturn is in the works. WTI oil prices have stabilized at a steady $40 per barrel and remained there throughout July. Although $40 is an historically low price, it is a level that has been seen by oil producers many times before. Fracking and the completion of drilled but uncompleted wells in July was the first sign of a meaningful turn up in oilfield activity. Recent company reports also show a cautious optimism that a bottom in activity has been found, and that renewed drilling and fracking is needed to protect lease agreements and to stabilize company production. For many companies, the operating goal is to keep production at or near recent levels, with any additional cash flow going to the pockets of shareholders. Once the backlog of drilled-but-uncompleted wells shrinks sufficiently, renewed drilling activity should follow.
- We are at or near the bottom for the rig count, a broad measure of oilfield activity, and the turn upward should follow soon. Although the price of oil remains low at $40 per barrel, higher levels of drilling can be justified today at that price and the rig count has room to rise from the current shock-induced levels. The rig count seems unlikely to reach a level as high as 575 working rigs before the second half of next year, or to return to pre-pandemic levels before the first half of 2022.
- Houston’s oil-related employment has shrunk by 26,000 jobs since mid-2019, but we have probably seen the worst for local job losses for now. As general oilfield activity improves based on current oil prices and an expected turn upward for drilling, local oil employment should follow soon after. Just as the rig count has room to rise from current shock-induced levels, there is room for oil-related employment to improve as well. However, continued low oil prices in the $40-$50 range should keep the number of Houston oil jobs below pre-COVID levels through mid-2022.
- Cumulative job losses for Houston’s upstream oil industry from December 2014 to the present now total 80,900 jobs or 33.9 percent, most coming after the bursting of a huge industry bubble built on $100 oil in 2015-16. Recent local losses in oil have been much smaller than the damage done in the 2015-16 downturn, but — even before COVID-19 and the oil war — the industry has been subject to repeated successive downsizings due to low to moderate oil prices, credit problems, and the poor management of many companies.
Some Recent History
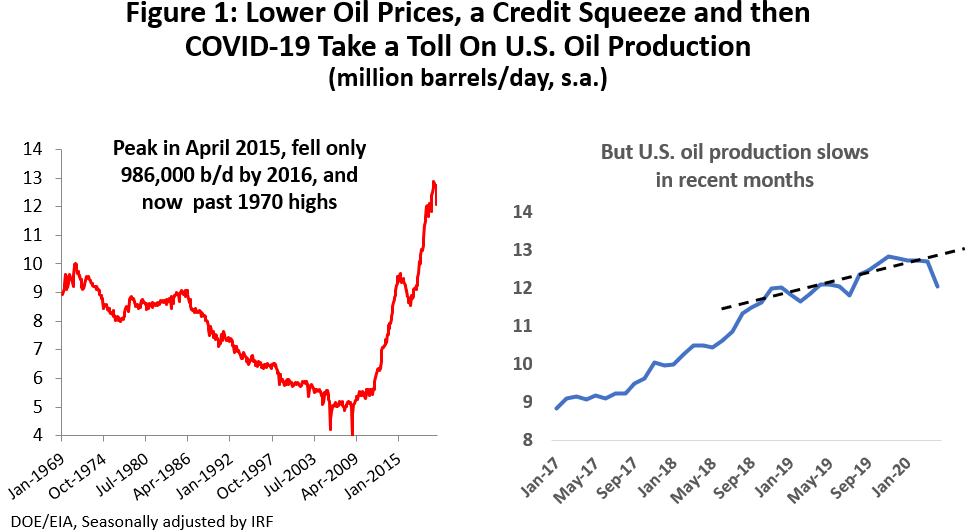
The most important event in the recent history of global oil markets has been the return of American oil production to all-time high levels. After U.S. production peaked near 10 million barrels per day in 1970, output fell steadily to half that level by the late 1990s. Then technological innovation led by horizontal drilling and hydraulic fracturing led a rejuvenation of U.S. oil, along with help from extensive domestic resources, a favorable legal and regulatory environment, and oil prices that rose to average $95 per barrel from 2011 to 2014. This combination led U.S. oil production back to 1970 levels of output and beyond. (Figure 1.)
The rise of U.S. fracking did not go unnoticed by the Saudis or Russians, the other two large global oil producers, or by other members of OPEC. Fracking is a relatively high-cost source of oil with a long-run marginal cost of production near $55-$65 per barrel. The recent global demand for oil has been near 100 million barrels of oil per day, outstripping the delivery capability of land-based oil from low-cost land sources in the Middle East or Russia or from the offshore shelf or deep water. This set the stage for the intensive development of higher-cost resources like U.S. shale, Canadian oil sands or from the arctic.
In November of 2014, OPEC led by the Saudis made a calculated decision to no longer support oil prices by cutting their own production. Watching the rise of U.S. oil production and how it had cut into OPEC’s market share, they withdrew as swing producer in world oil markets. Their goal was to force high-cost (and therefore uneconomic) sources of oil like fracking to make necessary production cuts, and by February 2016 the price of oil had briefly fallen under $30 per barrel and the number of U.S. working rigs fell from near 2,000 to 404. Figure 1 shows that U.S. production peaked in April 2015 and fell back by nearly a million barrels of oil per day in the following months.
In late 2016, OPEC declared victory and returned as swing producer, but if OPEC expected to gain market share, it proved a hollow victory. As soon as the Saudis and OPEC restored the previous production cuts and began to raise oil prices, U.S. fracking went back to work again. There was a rapid recovery and a push to all-time record levels of U.S. production.
The rising U.S. production continued to pressure not just OPEC’s market share, but also their ability to raise prices. In late 2016, the Saudis turned to the rival Russians and other non-OPEC countries for help in limiting global production and maintaining oil prices, and in November 2017 the so-called OPEC+ group was given quasi-official status. Cultural and economic differences between Saudis and Russians have caused sharp disagreement and conflict over oil policy in the past and would soon do so again.
The Fracking Credit Crunch
If U.S. oil was reshaped after 2005 by technological advances and given ready access to domestic resources, cheap money from the central bank also played a key role. The industry was literally born into the prolonged period of zero interest rates that followed the Great Recession, and the Federal Reserve’s expansion of its balance sheet was calculated to push investors into risky alternative assets like commodities.
The fracking industry developed with an industrial structure that set it well apart from the handful of large producers that had historically dominated American oil, companies like Shell, Exxon, BP, or Chevron that were focused on multi-billion dollar, multi-year projects that could take a decade before they would produce a barrel of oil. In contrast, fracking has a competitive structure comprised of many small operators with easy entry into the market; they are highly responsive to oil-price incentives and can quickly expand or shut down production that is geared to assembly line methods. Traditional oil risks are gone, production costs are well understood, and resulting output is quick and certain.
Cheap money and ease of entry invited a number of companies into the fracking industry with little interest in building a solid oil operation. With capital easily available, some geology and leases, and a service company to do the work, a hedge fund could be too easily transformed into an oil company. Unfortunately, the new company was too often run by a CFO instead of a CEO, and mainly interested in using low-cost borrowing, high leverage, and rising equity values as an opportunity to make money in trendy capital markets instead of the oil fields.
There are many solid companies in the fracking industry, but rising interest rates and oil priced in the $50-$60 range began to winnow out the others in 2018. Failure of many companies to deliver on either rising equity values or solid earnings led to the onset of major credit issues as lenders tightened borrowing requirements. By mid-2019, lenders had left only the most credit-worthy fracking companies with access to funds, and that is only if lenders made any effort at all to discriminate among these companies.
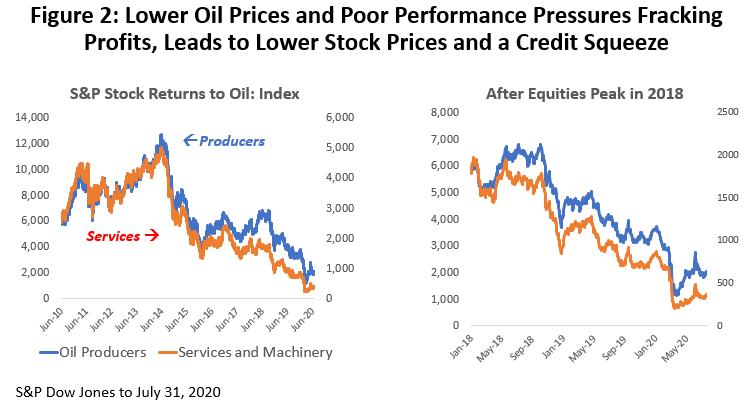
Figure 2 shows how equity markets made only a brief and limited recovery for oil producers and service companies after the Fracking Bust of 2015-16. Oil prices never again approached $100, and by October 2018 even that limited stock market recovery came to an end, with oil-related stocks entering a steady slide. We see the stock market literally turn its back on the oil industry, with a 46.0 percent fall in the value of producer stocks by the end of 2019 and 53.6 percent fall for oil services. This was just a prelude to Saudi-Russian conflict and COVID-19.
Financial stringencies extended past equities to corporate bonds and bank lines of credit, leaving many fracking companies dependent almost exclusively on cash flow. And cash flows began to be deliberately squeezed in recent months as OPEC and the Saudis settled on a pragmatic strategy of setting oil prices in the mid-$50 to $60 range. This was near the long-run marginal cost of production, high enough for OPEC members to live on, but not so high as to encourage rapid growth of U.S. oil output. (See Figure 3.)
The combination of moderate oil prices and limited access to credit began to generate serious balance sheet strains for many producers last year, resulting in bankruptcies and the delisting of a number of oil-related stocks from their exchanges. The right side of Figure 3 shows the rise in bankruptcies over six quarters, picking up in mid-2019, peaking in late 2019, and falling back briefly before COVID-19 and the oil war arrive in 2020Q2.
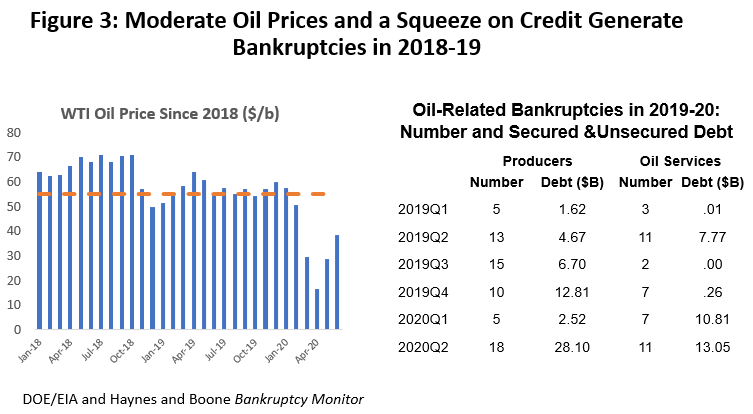
Figure 4 provides a longer-term perspective on industry bankruptcies and a list of the largest companies affected. Oil producers are the decision-makers in the oil industry, the companies that raise the capital, decide what to drill for and where, and assume the risk and reap the rewards of oil production. The oil service companies are hired contractors that follow the producer to the wellsite and carry out the drilling, fracking and completion of the project. They are dependent on producer leadership for their success.
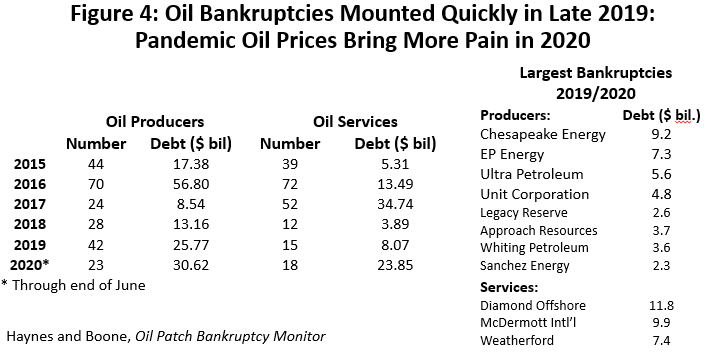
Through the first three quarters of 2019, the combined value of assets put at risk through bankruptcies was rising but seemed under control. To that point, there was no comparison to the damage done in 2016 and 2017 by the Fracking Bust. A report from the energy consulting firm Rystad Energy looked at the 40 largest fracking companies in late 2019, and found that they would likely face years of financial stringencies as they worked to clean up their balance sheets, but bankruptcy should be confined to peripheral players and not a problem for the core of the industry.
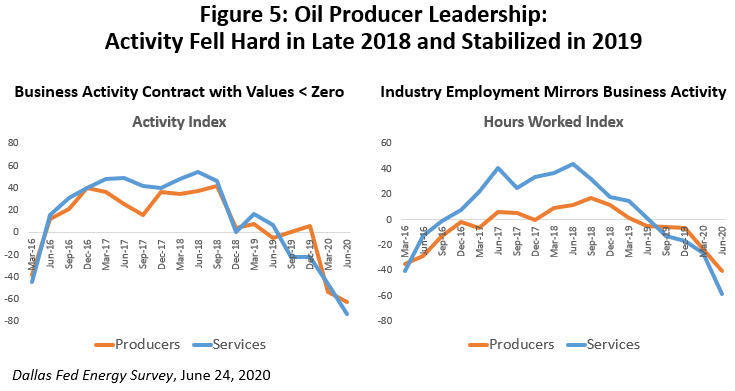
The December 2019 Energy Survey from the Federal Reserve Bank of Dallas shows a sudden reversal of oil-related business activity in late 2018, as the business activity index fell from a strong September reading above 40 for both producers and services to zero or the neutral point at year-end. (See Figure 5.) Business activity for the decision-making producer sector remained neutral through 2019 before later plunging with COVID-19. Services, in contrast, showed substantial weakness as the rig count fell and work dried up in early 2019. Industry employment mirrored the level of business activity.
Both the Rystad and Dallas Fed reports suggest that the credit crunch had worked its worst for oil by year-end 2019. The number of bankruptcies did rise sharply at year end, but it suggests a producer capitulation and not a likely continuation of the rising bankruptcy trend. This view that the worst of credit problems were being resolved is supported by the sharp fall in both the number and value of bankruptcies early in 2020.
Oil service bankruptcies in 2019-2020 if measured in terms of debt and assets at risk are mostly attributable to three very large companies: Diamond Offshore ($11.82 billion), McDermott ($9.92), and Weatherford ($7.43). A number of smaller and medium-sized companies make up the remaining 10 percent of debt subject to bankruptcy.
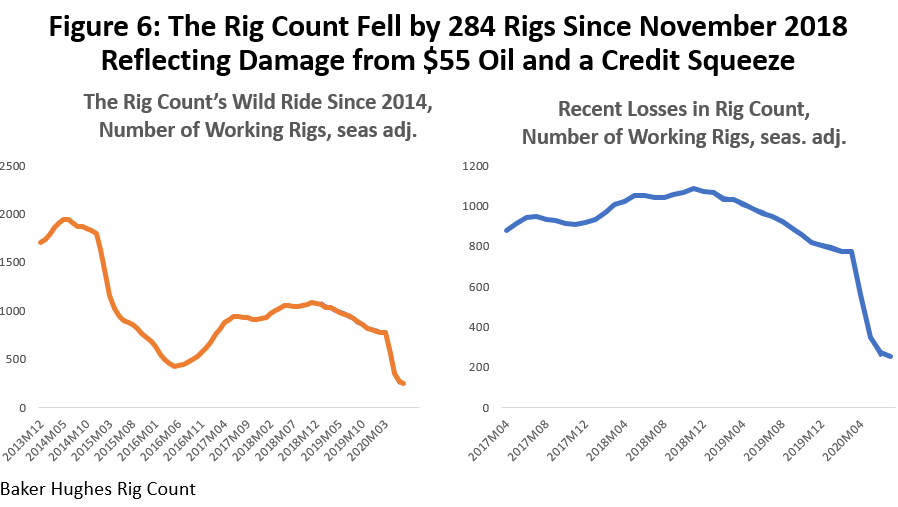
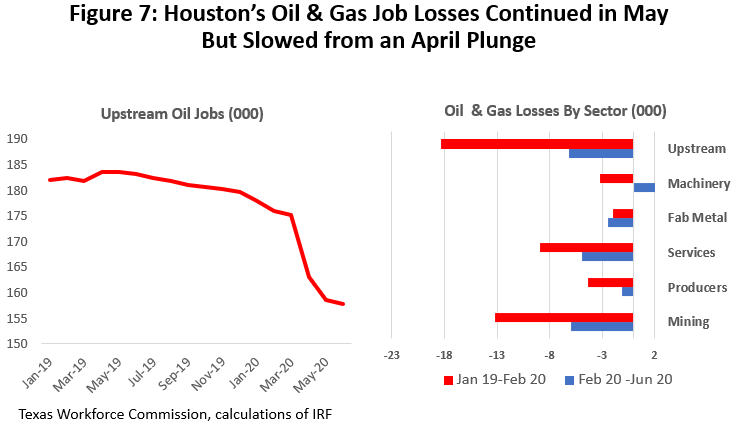
As we consider the effects of the coronavirus and oil war, it is important to remember that the oil industry was already under financial duress. For example, Figure 6 shows that the rig count in 2019 already had fallen by 273 rigs or 25.2 percent before the March and April plunge began. Figure 7 shows that the performance of Houston’s upstream oil jobs is nearly a mirror image of the rig count, with sustained losses of 6,100 jobs from January 2019 to February 2020 and before COVID-19.
In summation, the oil industry faced significant problems well before COVID-19, with a large segment of over-leveraged and underperforming companies already in a weak financial position. In early 2020, the industry was showing clear signs of stabilization in bankruptcies, rig count and employment, but a quiet period of stable global growth and moderate oil prices would have been required for full recuperation. Unfortunately, that is not what would happen.
The Oil War and COVID-19 Collide
The collision of COVID-19 and the oil war brought a simultaneous collapse in demand and supply: unprecedented stay-at-home orders issued around the world sharply limited demand while the Saudis and Russians simultaneously flooded the world with crude. The collapse in oil demand was not only predictable but was well underway before the oil war began. The combination created widespread chaos in April and May, especially in North American oil markets, and the U.S. oil industry is only now picking up the pieces and moving into recovery.
Both Russia and the Saudis officially deny there was an oil war, almost certainly because it turned into an embarrassing retreat for both sides. A short and unofficial version might be that the Russians and Saudis found themselves on opposite tracks regarding production cuts and oil prices in early March of this year. The Russians sensed American fracking was in a weak position because of its credit problems, and the time was right to let oil prices fall hard and inflict meaningful damage on U.S. producers. The Saudis and OPEC had already tried this in 2015-16 and found it costly and ultimately futile despite two years of low oil prices, a brief collapse in U.S. drilling, and widespread producer bankruptcy. The Saudis liked the price path they were on, moderate prices below $60 per barrel that protected their own revenues while limiting growth in U.S. fracking.
With the demand for oil already collapsing in March, the Saudis needed Russian help to cut production and protect prices at even at $55-$60 – but the Russians refused. When the Russians bragged they could survive on $40 oil for a prolonged period, Saudi pique led them to show the Russians that they too could survive on oil prices well below $40, opening up a bizarre contest to prove who could produce oil more cheaply and for the longer time. The global oil industry was suddenly caught in the middle of an industrywide collapse that would take place in a matter of days.
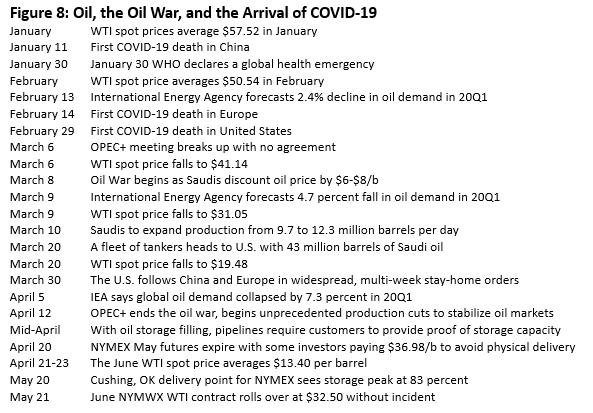
Figure 8 shows the timeline of events for early 2020 for oil markets, the oil war, and COVID-19. The spread of the coronavirus is tracked by early deaths in China, Europe and the U.S. Stay-at-home orders were in place by January 23 in China, in Italy by February 24, with Denmark, Spain, Germany and other European countries following by March 15. In the U.S., California issued the first stay-home orders on March 15, and by April 20 there were 316 million Americans in 42 states, Puerto Rico, and the District of Columbia subject to these public health orders.1
Limitations on travel, recreation, and the closing of other nonessential business saw seven million workers thrown out of work by early March and the demand for oil collapse along with these restrictions. In January, the International Energy Agency forecast no growth in global oil demand in the first quarter of 2020, then in February they predicted a decline of 2.4 percent, followed by a projected drop of 4.2 percent in March, and then 7.3 percent by April.2 It is in the middle of this demand collapse that we see the Saudis discounting their oil prices by $6 to $8 dollars per barrel on March 8, announcing an expansion of their domestic oil production from 9.7 to 12.3 million barrels per day on March 10, and shipping 43 million barrels of Saudi crude to U.S. ports by March 20.
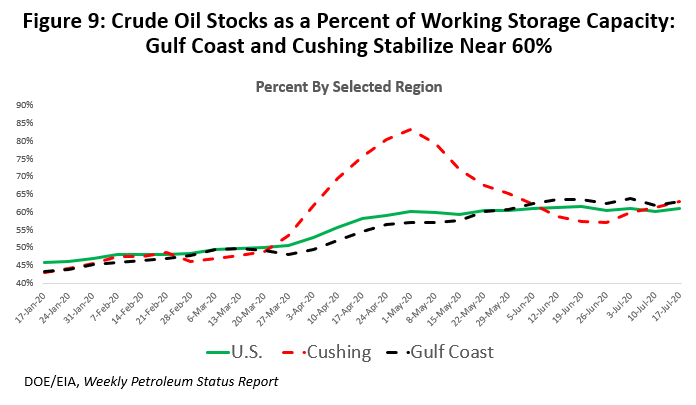
Continued U.S. oil production collided with this flood of Saudi crude, and by mid-April crude storage was rapidly shrinking. Pipelines began to require their customers to provide certificates of delivery guaranteeing availability of storage capacity for oil shipments. Figure 9 shows the share of working storage capacity that was full in the U.S. on April 10 (56%), at the large Gulf Coast operations (52%), and especially at the Cushing, Oklahoma NYMEX delivery point for WTI crude (70%). However, to say that the capacity is not full does not mean it is available to just anyone, with much of it owned and operated by companies working daily in the oil markets.
The storage problem became acute at Cushing, the only point that could settle the expiring May WTI futures contract, and with physical delivery required at Cushing by April 20. Hedge funds, retail investors, and other customers with no connection to physical markets found themselves unable to make delivery on about 14,900 contracts of 1000 barrels each and were ultimately forced to pay on average about $33.50 per barrel to find someone willing to take the oil off their hands and store it. The final settlement price of -$37.98 is often cited as a negative oil price for April 20, but the damage done to oil markets is better reflected in the average WTI price during the first three days of the new June contract which averaged $13.40 per barrel.
It took Saudis and Russians until April 12 to admit that the oil war was over and that COVID-19 had won the war by forcing oil prices that no one could afford. Russia and OPEC began to collectively clear the extraordinary damage that had been done. On April 12, OPEC+ announced the largest production cuts in their history: 9.7 million barrels per day initially, following up with cuts of 7.7 million barrels per day since July and that are expected to last through December.
U.S. oil producers began to collectively cut production after March 13, when U.S. output peaked at 13.1 million barrels per day and then fell to 11.9 million by May 1. U.S. production bottomed out on June 12 at 10.5 million barrels per day, and has begun to rise again, standing at 11.1 million by late July3. Some low-production stripper wells were shut in and that production may be lost permanently. However, most of the production cuts by fracking operators were by choking back wells temporarily, and these cuts can be quickly restored when it proves advantageous to the company. Crude storage in the U.S. and the Gulf Coast stabilized in June and July at about 60 percent of working capacity. Cushing saw storage peak in early May at about 83 percent before falling back to levels similar to the U.S. in recent weeks.
Stabilization in U.S. Oil Fields
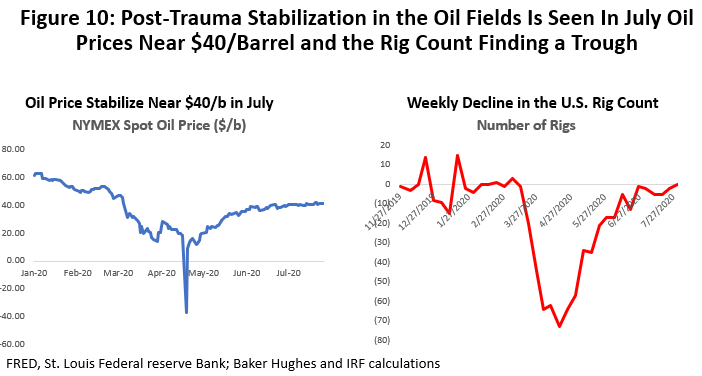
Efforts to curtail production by OPEC, Russia and the United States were beginning to pay dividends by late this summer. The June NYMEX WTI contract rolled over successfully and without incident on May 21 at $32.50 per barrel. The first WTI price reading over $40 was on June 22, and July saw oil prices register a very steady handle of $40 throughout the month. While oil prices remain low and well below historical norms at $40, at least they have found familiar territory at a price the industry has seen many times before. (See Figure 10.)
- Credit conditions had briefly stabilized early in 2020, but the onset of low oil prices could only bring more credit troubles to an industry left largely dependent on cash flow. The second quarter, along with all the other oil problems, saw a jump in the number of producer and service bankruptcies, with the value of affected debt in 2019-20 suddenly looking like 2016-17. In the second quarter, collateralized and uncollateralized losses were $30.62 billion for producers and $23.85 for services. (See Figures 3 and 4.)
- According to the June 24 Dallas Fed Energy Survey, the second quarter brought a plunge in business activity into contraction for both producers and services. The rate of contraction through late June was worse than 2016. (Figure 5.)
- The recent collapse in the rig count began in mid-March, coinciding with both the widespread stay-home orders and the oil war. Losses in the number of rigs peaked in the week of April 17 with 73 rigs, and then slowed week-by-week after that. Through early August, the rate of weekly losses had slowed to near zero, but a positive net gain in the rig count was not registered. The rig count has stabilized but sits at an all-time historic low near 250 working rigs. The previous low was in May 2016 with 404 working rigs. (See Figure 10.)
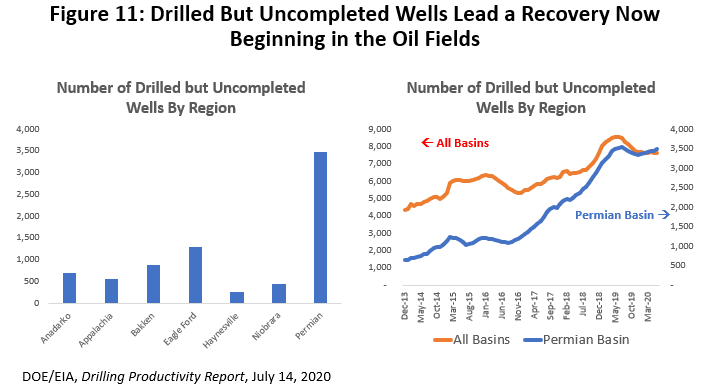
The first step in the recovery of U.S. oil was likely registered in July, as the number of fracking fleets turned up, indicating the start of a broader upward trend in oilfield activity.4 The first step in a new fracturing project is drilling the well, but the separate process of fracturing and completing the well incurs substantial activity and as much as two-thirds of the overall cost. There is typically a lag between the drilling and fracturing steps, and Figure 11 shows the number of drilled but uncompleted wells (DUCs) in July and across all U.S. oil basins to be near 7,700 with just under half in the Permian Basin. The wells are waiting for the arrival of a fleet trucks carrying pumps, water, sand and other liquids. The water and pumps will hydraulically fracture the rock, and the sands keeps the fractures open for gas, and liquids to flow to the surface when pressure is released on the well. Wellhead separators, storage tanks and emission controls are left on the surface.
In a new data series, Rystad Energy and Primary Vision are using satellite imaging to locate and count the number of U.S. fracking fleets. From January 2019 to March 2020, they counted 1,275 wells fractured each month. The number plunged to 444 in April, 336 in May, 325 in June, but July is now estimated to see the return of over 400 fleets5.
Recent company reports show signs of a cautious optimism that a bottom has been found, and that renewed drilling and fracking is needed to protect lease agreements and stabilize production. For many producers, the goal is to keep production at or near recent levels, with any additional cash flow going to the pockets of shareholders. Once the backlog of DUCS shrinks sufficiently, renewed drilling activity should follow.
Moving Forward
Thinking about moving forward is difficult right now and for many reasons. First, COVID-19 remains largely uncharacterized with public health authorities still offering little in definitive guidance on its case infection rate, mortality rate, effective treatments, the possibility of herd immunity or coming vaccines. In particular, we do not know when this pandemic might end. To make any sense of the problem, we need to provide a general framework that can guide us through the future. The result is not a forecast of where we are going, but they provide planning assumptions about how the economy might behave if the virus were to follow a particular path.
The planning assumptions used here have been laid out at length in prior reports and economic updates, and we continue to follow the same broad outlines6. A moderate U.S. recession began in the second quarter of 2020, continues through the first quarter of 2021, then as the economy moves into recovery, it takes five quarters for payroll employment to return to the 2020Q1 peak level. Employment numbers in 2020Q2 reflected desperate times throughout the country, while at the same time the stimulus package of last March temporarily replaced much of the income lost to unemployment. I assume substantial unemployment compensation continues through the fall. Underlying the huge quarterly swings in virus-driven economic activity — first negative, then positive later this year — is the ongoing moderate U.S. recession.
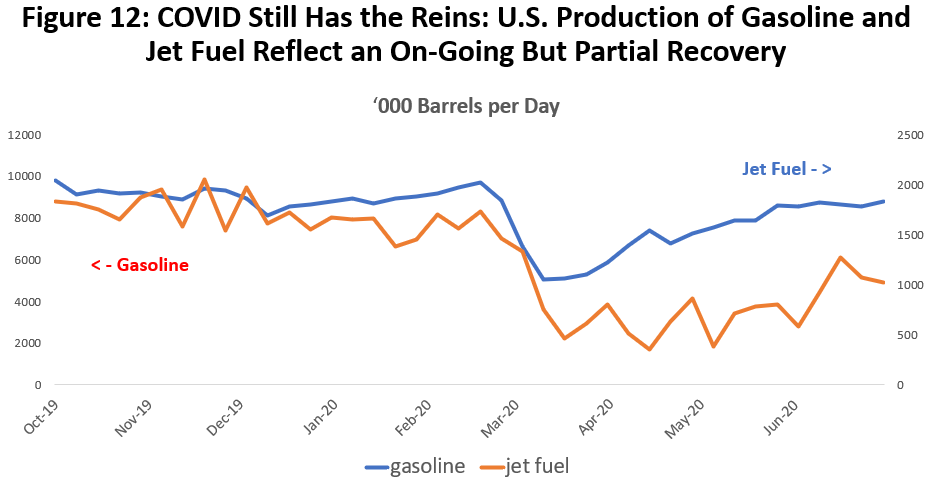
The easiest reminder for oil markets that COVID-19 still has the reins of the economy is the demand for oil as reflected in gasoline and jet fuel production, down from their March peak by 9.1 and 41.0 percent, respectively7. (See Figure 12.) It is good that oilfield activity is stabilizing at $40, but it is largely thanks to COVID-19 that we will live with low oil prices for months to come.
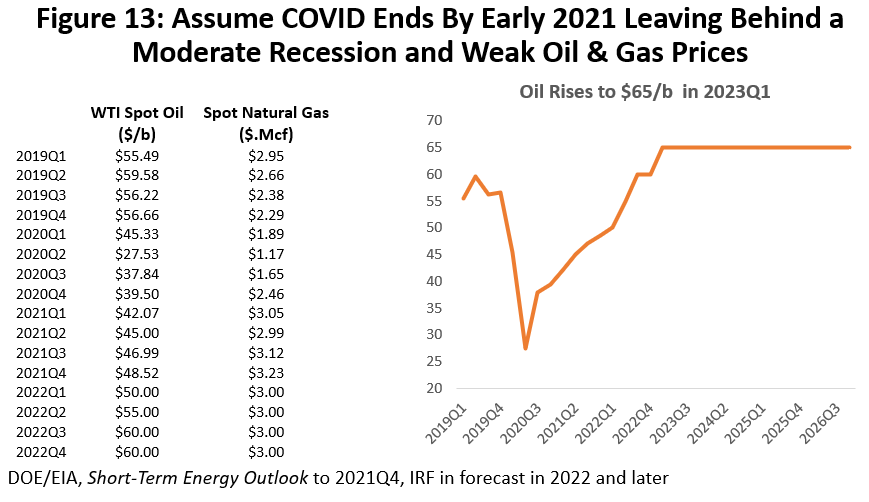
Our starting point for the road ahead in oil and gas is the forecast of oil and natural gas prices in Figure 13, taken from the EIA’s current short-term forecast through the end of 20218. After 2021, oil prices are from the Institute for Regional Forecasting. A long, slow path to oil-price recovery is reflected in prices that remain below $50 through the end of 2021. Natural gas prices similarly remain low at $2-$3 per thousand cubic feet. After 2022, we see oil prices begin to rise quickly to the $60-$65 range that reflects the long-run marginal cost of oil. Natural gas moves up to a steady $3.
We have a good statistical handle on how changes in oil and natural gas prices affect the number of rigs at work in the U.S. Oil prices are the primary driver, and a one percent change in the price of WTI, for example, will typically cause the rig count to rise by almost half of one percent over the following 10 months. For example, if the rig count had been in equilibrium when it peaked in 2018Q4 and the price of oil had risen by five percent to $62.56 and stayed there for ten months, the rig count would have risen by 46.
The rig count averaged 1,845 from 2012 to 2014, but after the 2015-16 oil bust it returned to a peak of only 1,076 in 2018Q4 before falling back. Technology is often given credit for a lower rig count as the size and power of modern rigs displaced older ones. However, the statistics say that even given technology and oil price, that there was also a sudden shift down by 14 percent in the number of rigs working in 2015-16 that probably reflected nothing more than the end of the fracking bubble. That shift down remains in place today and presumably into the future. But the biggest factor in a lower rig count now versus 2014 was simply the fall in oil prices from near $100 per barrel to the $55-$65 we have seen in recent quarters.
What happened in the second quarter of this year with COVID-19 and the oil war was a large exogenous shock, i.e., an event driven by outside factors not usually considered in oil-related analysis. While oil prices were affected and fell rapidly, the primary impact of the shock was to force immediate and extensive nonprice-related shutdowns to protect people, equipment, and the future of the industry. In Figure 14, the blue line is recent history, including the 2020Q2 collapse in the rig count to 387 rigs . Like war or an approaching hurricane, the effect of the pandemic was not just another turn in the business cycle.
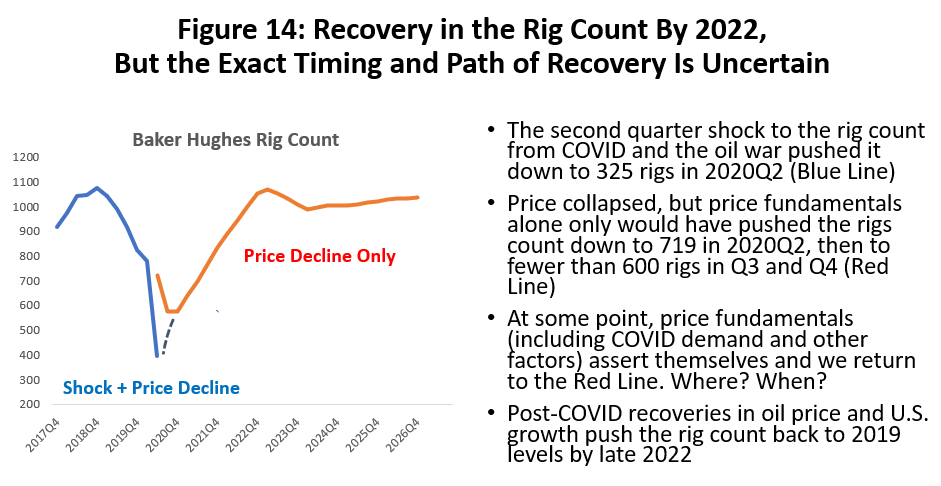
The blue line follows a weak and falling rig count due to poor credit conditions and moderate oil prices that is later joined by COVID-19 and the oil war. Using a statistical trick, we can ask how far the rig count would have fallen if only lower oil prices and other normal statistical influences mattered9. Price alone would have driven a 2020Q2 fall of only 64 rigs, while the shock was responsible for an additional fall of 324.
The red line tells us what would have happened to the rig count if only oil prices and the business cycle were at work, but without the shock. The number of rigs continues to fall through 2020Q4 as price falls and then stabilizes near $40 per barrel. At some point later this year, the shock wears off with the oil war put behind us and COVID-19 hopefully coming under control. Only oil-price fundamentals are then left to matter again. We will see the blue and red line connect. Exactly how we get from blue to red lines — along some broken line like that in Figure 14 — and when that connection occurs cannot be known analytically, but once it happens and we join the red line it stays there through the years to come.
The bottom line for oilfield activity is that we are approaching a trough for the rig count -- a broad measure of oilfield activity -- and the turn upward should follow soon. Although the price of oil remains low at $40 per barrel, drilling can be justified today and the rig count has meaningful room to rise from the current shock-induced levels. We have already seen initial progress in the fracking and completion of already-drilled wells, and producers are indicating a return to drilling to protect lease obligations and to maintain current levels of production. The rig count seems unlikely to reach 575 working rigs before the first half of next year, or to return to pre-pandemic levels before the first half of 2022.
Oil-Related Employment in Houston
When OPEC withdrew as swing producer in 2015-16, it burst a huge fracking bubble that had been building for years based on $100 oil. The results were a collapse in oil prices, a fall in rig count to then-record low levels, and the loss of 77,300 upstream oil jobs in Houston. The chart in Figure 15 compares the 2015-16 downturn to the 1980’s collapse in oil markets before and after their peak, and it shows a drop in local oil employment in 2015-16 that matched the speed and ferocity of the 1980’s collapse in oil markets.
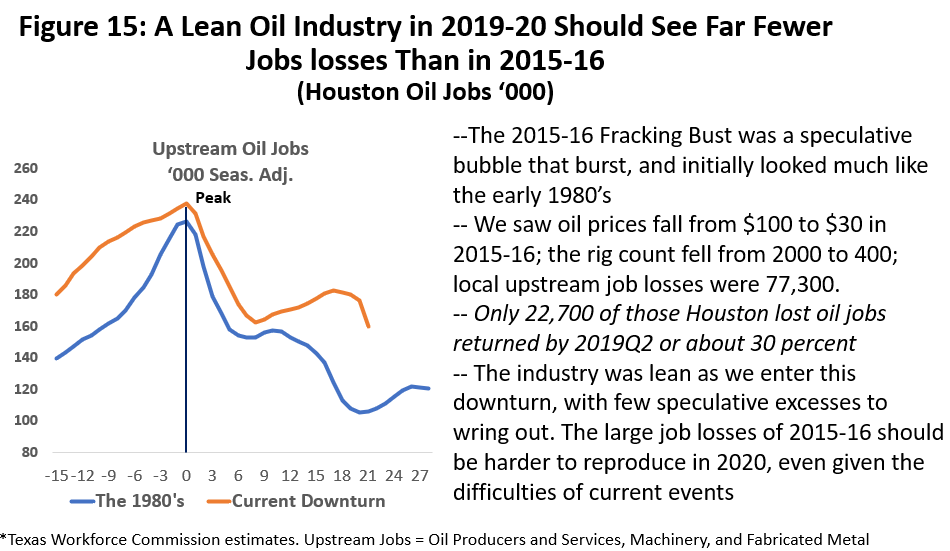
Like the 1980s, once the bubble burst many of the jobs lost to the Fracking Bust were never likely to return. By the time the local industry recovered and reached its latest peak in oil-related jobs in 2019Q2, only 22,700 of the jobs lost during 2015-16 had returned or about 30 percent. Then in 2019, the credit squeeze began to again force reductions in local oil jobs. Not only was their no fat left in industry employment by this time, the pre-COVID industry was actively complaining that reduced headcounts had reached muscle and bone.
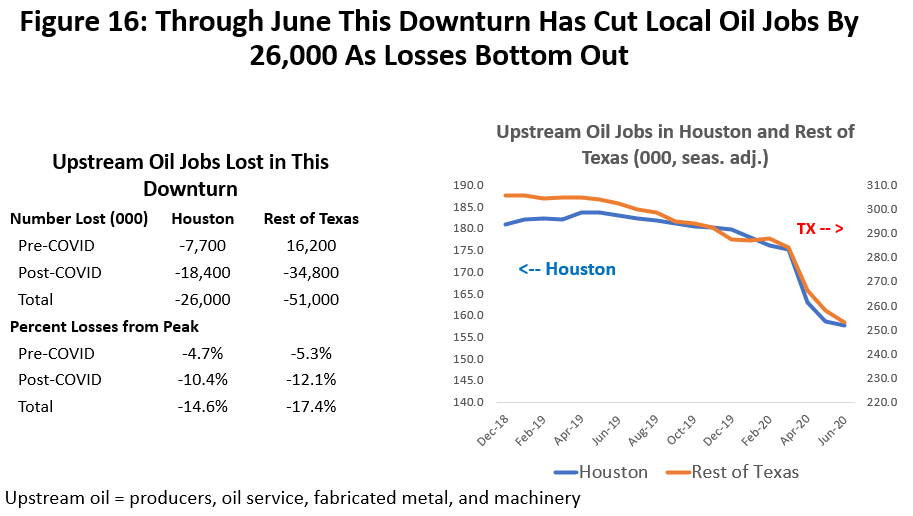
While recent job losses have been substantial through credit losses, the oil war, and COVID-19, Figure 16 shows Houston-based losses that total 26,000 or 14.6 percent of the 2019 peak. In Texas, excluding Houston, losses total 51,000 or 17.4 percent of the previous peak. As the figure shows, the timing and rate of decline of jobs was nearly identical in Houston and Texas. The job losses sustained in Houston so far are only a third of those seen in 2015-16, and you have to believe that the worst might be over if oil prices can remain stable at the current $40 per barrel.
In Figure 17 we have repeated the analysis of the rig count in Figure 14, only this time asking how many of the 16,200 jobs that Houston lost in the second quarter were due to the fall in oil prices and how much was an exogenous shock. The rig count is a good indicator of changes in oil employment in Houston. For example, if the rig count were at 1,000 and rose to 1,050, it would result in a 1.2 percent increase in local oil-related employment or close to 2,000 jobs. These increases and decreases driven by the rig count tend to come slowly, however, spread out over as much as 10 quarters.
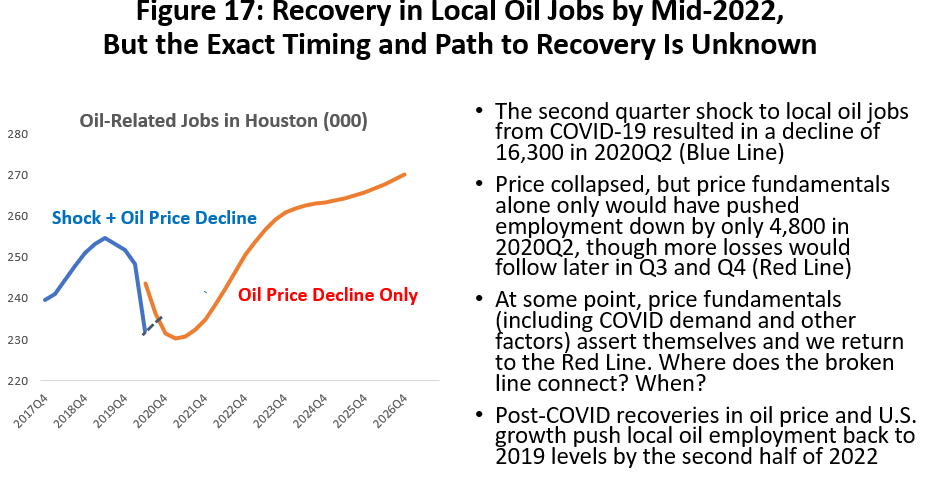
Because the local employment losses associated with the effects of a falling rig count come slowly, the one-quarter drop of 16,300 local oil jobs in 2020Q2 is almost all due to the exogenous shock. Only about 4,800 jobs responded to the immediate fall in the rig count and oil prices. The blue line is the history of local oil employment, including the COVID/oil war plunge. The red line is where we could have been if price and the rig count had just followed the business cycle and oil prices. Note that the red line continues to fall through 2021Q1, pulling oil employment down to 230,000 jobs and 2,000 jobs below the shock levels of 2020Q2. Again, we do not know the path from blue to red lines, but with the oil war over and COVID hopefully coming under control, we should find equilibrium and the two lines joining up by early next year.
Given the ordeal that Texas oil and natural gas have undergone in recent months, the job losses are small in comparison to 2015-16. We have given reasons for this: there was no $100 price bubble this time, job recovery from the last downturn was scant, the industry employment remained quite lean as this latest job decline began, and this downturn was well underway before COVID arrived.
Perhaps the biggest risk that these numbers might be larger than we think is that the Texas Workforce Commission may have underestimated the recent loss of oil jobs. The changes in oil-related payroll employment in Figure 16, for example, are based on a sample of local employers, and past annual revisions have brought some big changes to total employment for Houston, and even bigger percentage changes for specific industries like oil and gas. Under the current chaotic economic conditions, large revisions to statistics become an even bigger concern.
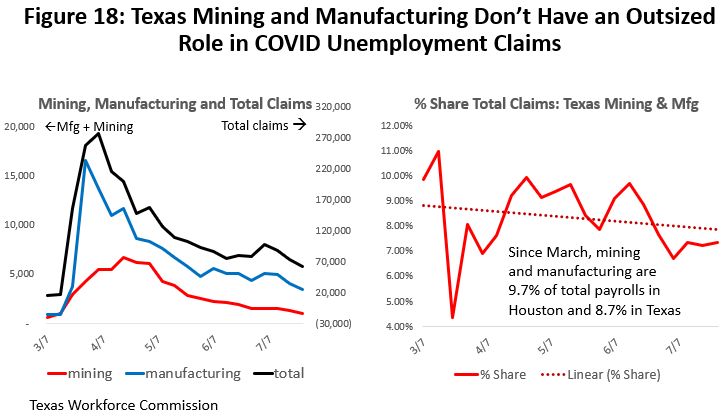
One clue that the oil-related numbers might not be too far out of line is the Texas industry-specific data on recent unemployment claims. Claims for unemployment for mining and manufacturing do not play an out-sized role in the March/April spike in total claims. Unfortunately, we do not have Houston data by industry, but initial claims in Houston and across the state have closely followed similar patterns. The left side of Figure 18 shows the number of recent Texas initial unemployment claims for mining and manufacturing since early March.
The right side of Figure 18 shows that unemployment claims from the mining and manufacturing sectors have accounted for about 8-9 percent of statewide unemployment claims. Employment losses in mining and manufacturing are not over-represented, since combined payroll jobs in mining and manufacturing making up 9.7 percent of Houston’s payroll jobs and 8.7 percent in Texas.
The bottom line for Houston’s oil-related employment is that we have probably seen the worst for local oil jobs. As general oilfield activity improves based on current oil prices and an expected turn upward begins for drilling, local oil employment should follow in coming quarters. Just as the rig count has substantial room to rise from current shock-induced levels, there is room for oil-related employment to improve as well. However, continued low oil prices should keep Houston’s oil-related employment below pre-COVID levels through mid-2022. Houston’s job losses have been less than we observed in the 2015-16 downturn despite repeated earlier downsizings forced by credit problems, low to moderate oil prices, and the poor management of numerous companies.
Qualifications
Because uncertainties surrounding COVID-19 and the recovery from the oil war, we have much less to guide us into the future than normal. In a previous section of this report called Moving Forward, we discussed a broad U.S. macroeconomic background that has to be largely assumed to even discuss the future. It outlined a moderate recession marked by big negative and then positive changes in employment and income as we moved through the year, followed by another year of recovery. As we also said in that section, the forward-looking charts and graphs on oil prices, rig counts, and oil-related employment must be regarded as planning assumptions rather than a forecast.
It is also important to understand the following assumptions. Many readers of this report will bring a much less optimistic outlook to the future of fracking and the local oil industry, perhaps because of the qualifications below.
- For the short-run — quarterly results through at least early next year — neither markets nor economic models are working. By the first quarter of next year, we should be able to have some faith in our understanding of economic outcomes, but even that depends on still little-understood progress in containing the virus.
- We are assuming that monetary and fiscal policy can effectively fill much of the stay-home and social distancing employment gap left by COVID-19. The huge employment losses in early 2020 were substantially offset by income from the stimulus. We assume stimulus is provided to the extent needed to offset continued social distancing costs.
- There is no permanent damage to the American oil industry due to credit problems, COVID-19, the oil war, or the long period of oil prices at or below $40 per barrel. Bankruptcy is a process of cleaning up balance sheets for a restructured company or passing the assets to other hands. The oil asset remains in place,
- Houston’s economy returns to its long-run annual growth rate for payroll employment growth near 1.9 percent. The period of growth lost to the COVID-19 recession is not recovered, however.
Written by Dr. Robert W. “Bill” Gilmer
August 9, 2020
University of Houston
C. T. Bauer College of Business
Institute for Regional Forecasting
1 Sarah Marvosh, et al. ”See Which States and Cities Have Told Residents to Stay Home,” NY Times, April 2020.
2 International Energy Administration, Oil Market Report, February 13, March 9 and April 5.
3 Energy Information Administration, Petroleum Weekly Status Report, July 29, 2020.
4 I have used the term “fracking fleet” here, although “fracking spread” is also very common. Fracking spread, however, is an also commonly used to describe the difference between the wellhead value of natural gas and its methane component, i.e., the value of the natural gas liquids like butane, propane or ethane.
5 “U.S. Fracking Set to First Monthly Rise of the Year,” Oil and Gas Journal, August 3, 2020, p. 12.
6 R.W. Gilmer, “Houston’s Outlook Reshaped by COVID-19 and the Oil Collapse: Perspectives on the Economy from the Early Pandemic Data,” https://www.bauer.uh.edu/centers/irf/houston-updates-june20.php
7 Energy Information Administration, Weekly Petroleum Status Report, July 29, 2010.
8 Energy Information Administration, Short Term Energy Outlook, July 2020.
9 For the first and second quarter of 2020, we used a dummy variable for each quarter to see if non-price factors were at work and by how much. They were not meaningful in 2020Q1 but were highly significant in Q2 with a t-value of 11.7 and indicating structural damage of some kind. Neutralizing that statistical estimate gives us the estimate of non-shock behavior.