Houston Updates
-
Archive
- June 2025
- March 2025
- December 10, 2024
- September 14, 2024
- May 21, 2024
- March 19, 2024
- December 9, 2023
- June 16, 2023
- April 6, 2023
- March 17, 2023
- Dec. 19, 2022
- Sept. 14, 2022
- July 4, 2022
- March 27, 2022
- March 9, 2022
- September 2021
- April 2021
- March 2021
- September 2020
- August 2020
- June 2020
- April 2020
- March 2020
- January 2020
- December 2018
- June 2018
- March 2018
- February 2018
- January 2018
- September 2017
- September 2017 Post-Hurricane
- June 2017
- March 2017
- January 2017
- September 2016
- March 2016
- December 2015
- September 2015
- June 2015
- March 2015
- December 2014
- June 2014
- March 2014
- November 2013
- September 2013
Houston Economic Update: A Summer Lost in Limbo?
September 6, 2016
The dictionary defines limbo as an uncertain situation that you cannot control, and where there is no progress or improvement. This spring saw oil prices look like they were on the mend, pushing steadily back to $50 per barrel – only to spend the summer directionless and range-bound near $45. Data from the Texas Workforce Commission say that local payrolls absorbed the winter shock from the collapse in drilling with only scattered overall job losses, and stabilized over the spring and summer. As summer ends, the recent lack of conviction by oil markets also has left the local economy in an uncertain and directionless state.
The oil bust turned very bad late last year – very ugly – worse than anything anticipated as the downturn began. In many ways, this drilling downturn is worse than the 1980s, particularly in the speed of the decline. It took five years from 1982-87 to achieve the percentage declines in drilling activity that we have seen this time in less than 18 months. And when the Baker Hughes rig count fell through 488 working rigs on March 11, it marked the smallest number of working rigs in the 67-year history of the Baker Hughes rig count. Drilling activity now seems to have bottomed at 404 rigs, and returned to near 500 rigs, but the number still sits close to that previous record low. Future improvement remains uncertain as oil prices hover near $45.
Official Figures Point to No-Growth Scenario
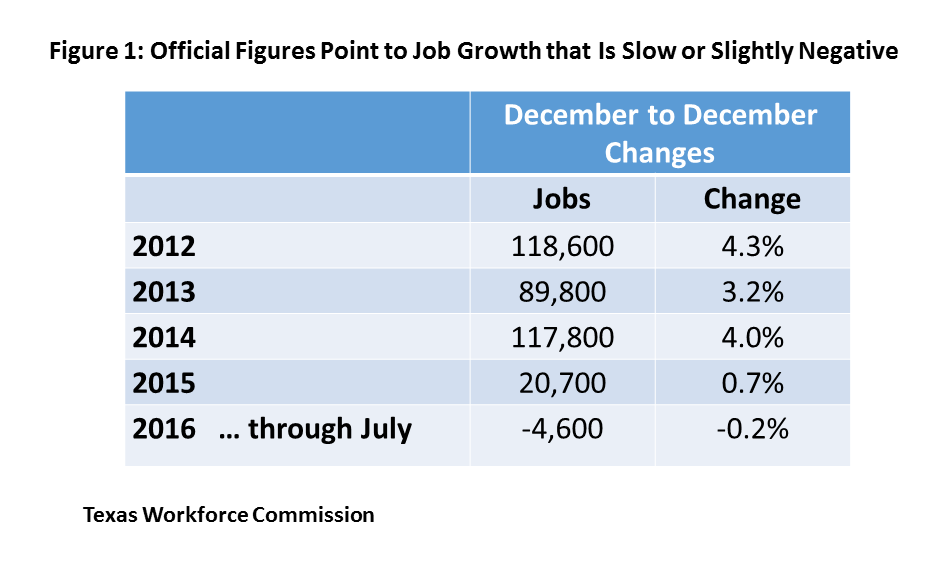
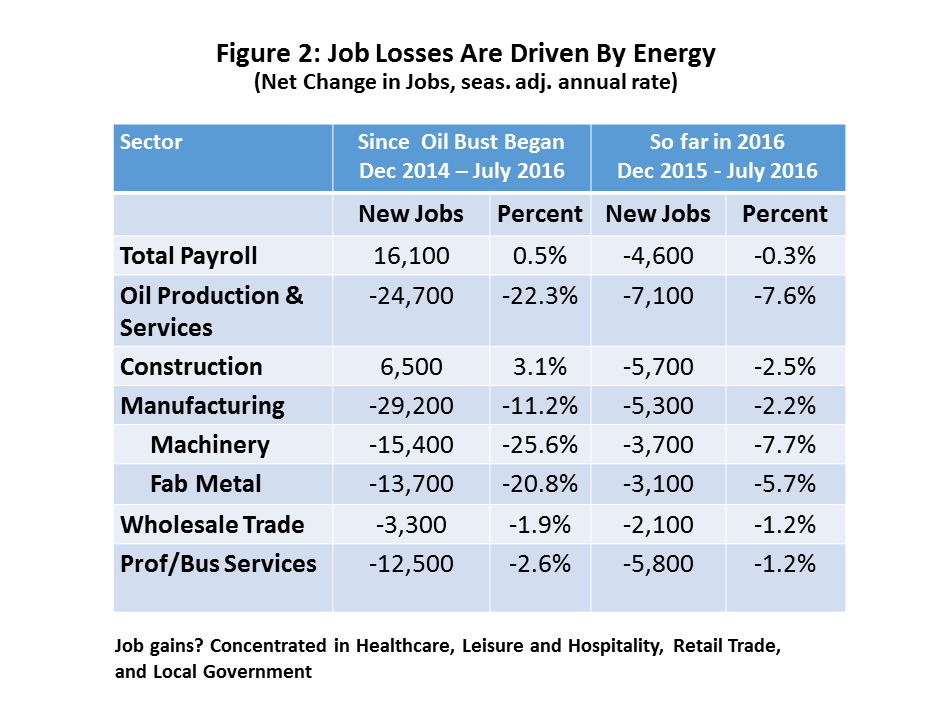
The official employment figures for Houston show weak growth in an economy that is directionless and apparently waiting for oil markets to provide some direction. After creating only 20,700 jobs in 2015, Houston lost 4,600 jobs over the first seven months of the year. See Figure 1. Job losses now total near 70,000 in oil- and gas-related industries such as oil production, oil services, machinery, fabricated metal, wholesale trade, and oil-related professional and business services. Despite the collapse of oil prices and the rig count in late 2015, the Texas Workforce Commission’s (TWC) payroll employment figures show oil-related job losses slowing in 2016, perhaps as cuts for many companies have finally reached muscle and bone. See Figure 2.
Since the oil bust began in late 2014, job gains have continued in many sectors and have offset the energy losses. Solid growth in the U.S. economy, together with strong expansion in east Houston led by booming petrochemical construction, have provided broad support for many local businesses that are not tied to drilling. Continued job gains have come in eating and drinking establishments (26,600), health care (22,000), retail trade (14,500), and local government (11,000).


As discussed in earlier updates, however, many of these job gains have also been built on residual growth and momentum left over from the oil boom years, and we can’t count on them to carry the economy much longer. From December 2003 to December 2014, metropolitan Houston created 683,000 jobs, equivalent in number to a new Oklahoma City. Just because job growth slowed sharply in 2015, it did not mean that the catch-up phase was over for medical care, restaurants, retail, or housing. High levels of construction of hospitals, schools, and highways continue even now, although single-family homes, apartments and offices are finally pulling back. But momentum continues to dwindle as Houston’s economy looks for direction.
Or is Houston Already in Recession?
The monthly payroll employment figures generated by the Texas Workforce Commission, in partnership with the Bureau of Labor Statistics (BLS), are the most timely and comprehensive data that we receive on Houston’s economy. Payroll employment is essentially the number of local workers eligible for unemployment compensation, and administrative records will ultimately provide us with a very accurate count. However, it will take several months for any administrative records to be pulled together, and a couple of years before the numbers are no longer subject to routine revision. The timeliest monthly figures that we receive are based on a sample of local employers in a variety of industries, with the accuracy of the results dependent on the size and quality of the sample. For a large and complex metro area like Houston, a sample drawn and used to capture small month-to-month changes can sometimes go astray at turning points in the business cycle.
Data to begin revising the sample estimates are available from the Quarterly Census of Employment and Wages (QCEW) several months after initial estimates are made, but the TWC holds off on major revisions until early March of each year, when it incorporates the new employment data in its annual re-benchmarking process. We are still six months out from official revisions, but the Federal Reserve Bank of Dallas publishes preliminary revisions for Texas and its metropolitan areas as the QCEW data become available. This provides a preliminary but continuously-revised window into the local payroll employment data.
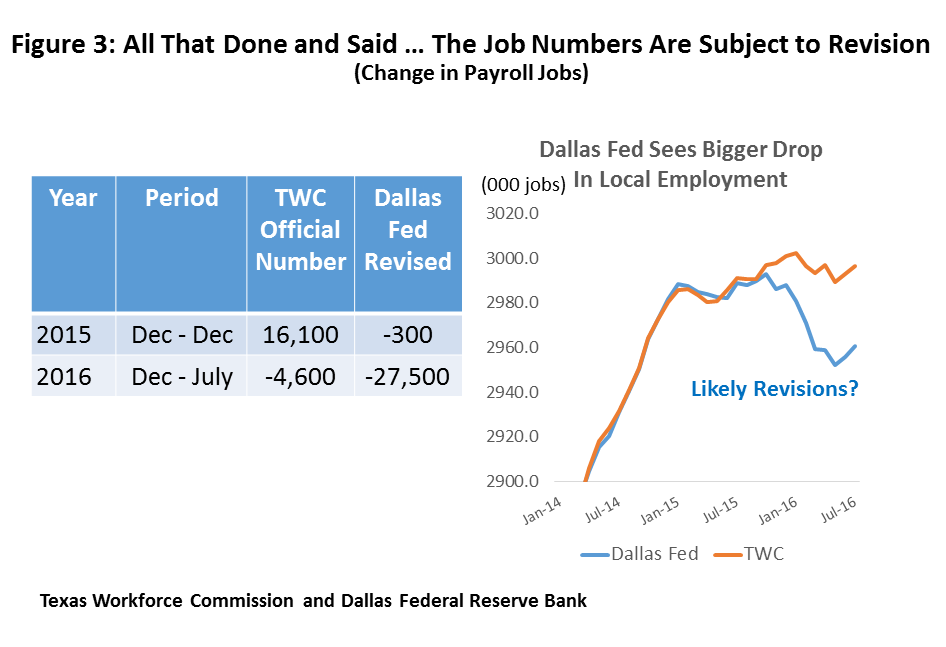
Figure 3 shows the result of the Dallas Fed’s latest local revision based on QCEW data through 2016Q1, and the figures are not pretty. Instead of a gain of 16,100 jobs in 2015, Houston shows a loss of 300 jobs; and in 2016, a published December to July loss of 4,600 turns into a reduction of 27,500. Job losses were evidently underestimated in energy-related manufacturing (7,500), wholesale trade (8,300), and professional and business services (2,000). Job gains in leisure and hospitality (most likely in eating and drinking establishments) was over-estimated by 12,700 jobs.

Has Houston slipped into recession? Given the speed and depth of the drilling downturn, no one should be surprised if the answer is yes. But we have also moved into a useful if somewhat murky statistical world based on second-party revisions subject to more revisions. The TWC’s major re-benchmarking in March will rely on data and methodology not always available to the Dallas Fed. Further, while payroll employment is widely regarded as a very good coincident indicator over the business cycle, before declaring recession we would surely want to look at a broader set of data.
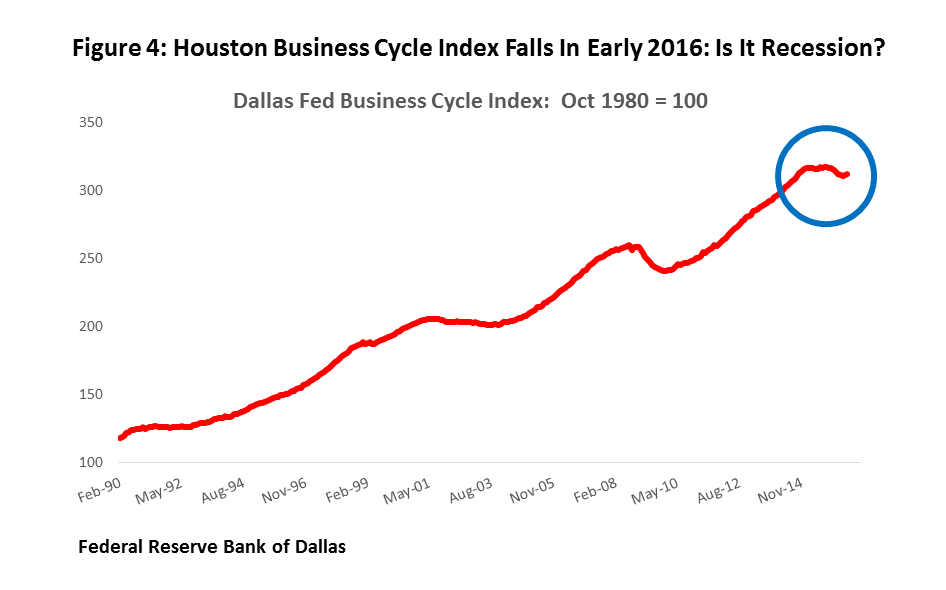
The Dallas Fed provides another product that is specifically designed to track the business cycle of Texas and its metro areas by looking at four variables: payroll employment, the unemployment rate, real wages, and real retail sales. These variables are combined into a business cycle indicator (BCI), specifically intended to track local business conditions. The current Houston index is shown in Figure 4, and it says that the local business cycle peaked last December and has since contracted 1.5 percent.

It is probably still too early to definitively say if we are in recession or not. Like the payroll employment figures, the data on real wages and real retail sales arrive a couple of quarters late, and are also subject to further revision. The Business Cycle Dating Committee of the National Bureau of Economic Research is the official umpire that declares turning points in the national business cycle, and it often waits several quarters to announce that a recession has begun or ended, waiting out revisions and look for signals from multiple data sources. Since regional data comes with even longer time lags and more statistical noise, a similar wait is easily justified here.
If it is a recession in Houston, some readers will quickly jump to a comparison to the 1980s. The 1980s were indeed very bad, but as the BCI shows in Figure 4, we have had two other recessions in Houston since the 1980s, one mild (2001-03) and one severe (2008-09). Recession doesn’t come in just one size and shape. In the current case, we are talking about a possible loss of 27,500 jobs, or a less than one percent decline in payrolls. Between 1982 and 1987, Houston lost 210,000 jobs or 13.3 percent of payroll employment. The local economy in 1982 was almost exactly half the size it is today, and an equivalent job decline in 2016 would be 420,000 jobs, or 14 times the losses discussed here. The 1982-87 decline in the Dallas Fed’s BCI for Houston was 17.2 percent, not the current 1.5 percent. If there is really a local recession now underway, it is not yet within an order of magnitude of the 1980s.
Where from Here?
If current economic conditions are difficult to sort out, then peering into the economic future presents some real challenges. Our Fall Economic Symposium on November 10 will dive deeply into all these issues, and we will try at that time to distill them into an economic outlook for Houston.
- The U.S. economy has performed well throughout the oil downturn, providing a critical source of local job growth. Over long periods of time, broad trends in national growth probably deliver two-thirds of Houston’s new jobs. The probability of national recession remains low, but this is a rapidly aging expansion. Also, how do we explain the current strange split between several quarters of very slow GDP growth and continued strong job growth?
- The other major factor that keeps Houston’s economy afloat during the drilling collapse is the $50 billion in petrochemical construction underway in east Houston. This one-time event is now coming to a close, however, and the work will wind down quickly in coming months. This important and timely source of job growth in the early stages of the drilling downturn will slowly build into a drag on the economy as thousands of construction workers are laid off in coming quarters.
- The big question is still where oil prices are headed. Current oil prices, muddling along between $40 and $50 per barrel, are not high enough to deliver sustained recovery in the oil patch. The gap between global oil supply and demand has never been large – only a couple of million barrels per day – but it has been difficult to close. However, analyst are increasingly pointing to a return to balanced markets in coming months.
- Has the rig count made a definitive turn? Higher oil prices in the spring and early summer seemed to bring drilling back to life, as producers increased capital spending and put rigs back to work. But can this upturn continue as oil prices stall out? We need a definitive turn in drilling to convince producers and oil service companies to begin hiring again in 2017. We need these drilling jobs to offset losses in chemical construction.
The bottom line: if Houston has not already slipped into recession, it will be very hard to avoid recession going forward. Even assuming strong U.S. growth, the combination of an end to petrochemical construction and a prolonged or slow turn in oil prices and drilling markets would likely bring a downturn. Avoiding recession now will take a convincing surge in oil prices – one that begins very soon and looks like it is here to stay.
Written by:
Robert W. Gilmer, Ph.D.
Institute for Regional Forecasting
September 6, 2016