Houston Updates
-
Archive
- June 2025
- March 2025
- December 10, 2024
- September 14, 2024
- May 21, 2024
- March 19, 2024
- December 9, 2023
- June 16, 2023
- April 6, 2023
- March 17, 2023
- Dec. 19, 2022
- Sept. 14, 2022
- July 4, 2022
- March 27, 2022
- March 9, 2022
- September 2021
- April 2021
- March 2021
- September 2020
- August 2020
- June 2020
- April 2020
- March 2020
- January 2020
- December 2018
- June 2018
- March 2018
- February 2018
- January 2018
- September 2017
- September 2017 Post-Hurricane
- June 2017
- March 2017
- January 2017
- September 2016
- March 2016
- December 2015
- September 2015
- June 2015
- March 2015
- December 2014
- June 2014
- March 2014
- November 2013
- September 2013
Benchmark Revisions Confirm Loss Of Momentum in Local Job Growth
March 10, 2014
The most important and current data we receive on Houston’s economy are the monthly payroll employment figures. The monthly data are estimates of the number of Houston workers eligible for unemployment insurance under the Employment Security Program that is operated by the State of Texas. The initial estimates are based on a sample of employers, but after several months the unemployment compensation data stabilize to provide an actual figure for the total number of covered employees, as well as the final number of workers in many key industries. Each March, the Bureau of Labor Statistics and Texas Workforce Commission look back to replace the sample data with actual — or at least much more accurate — counts, and to provide revised jobs numbers that cover a year or more. This latest benchmarking for Houston was released on March 7, and — as always — it rewrote recent economic history.
The latest revisions reached back as far as early 2012 and rebenchmarked data through the third quarter of 2013. Fourth quarter data and early 2014 remain sample estimates. The effect of the revision was to increase Houston’s estimated December to December job growth figure in 2012 from 105,700 to 114,500, and to reduce 2013 job growth from 82,000 to 76,200.
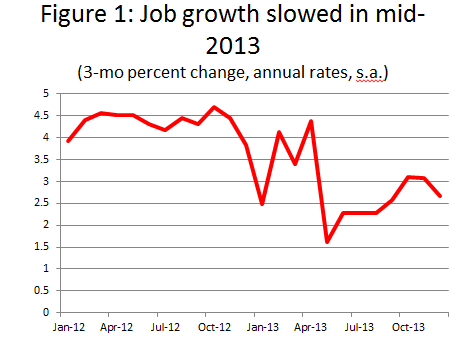
These new figures again confirm that 2012 was one of the greatest years ever for Houston job growth, but they also reinforce that we are seeing a broad pullback in the pace at which we are adding new jobs, and that slower growth began in mid-2013. Figure 1 shows annual rates of employment growth near 4.0 percent in 2012 and early 2013, but pulling back to a rate of 2.5 percent by year-end. The current 2013 estimate is a December to December change of 76,200 new jobs that closely matches our long-standing forecast of 74,000. The 2013 result is a 2.8 percent annual increase, well below the monster year of 2012, but also well above Houston’s long-term average of 2.2 percent.

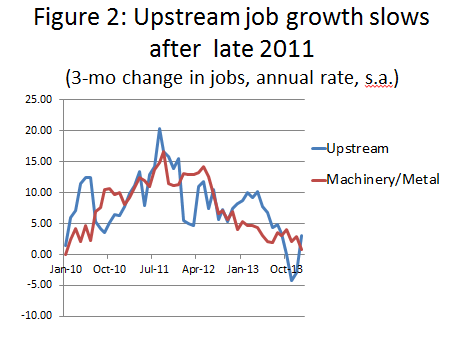
Why the slowdown? A boom in upstream oil and gas drove domestic exploration and production spending at compound 20 percent annual rates from 2002-2012, but these E&P expenditures have been flat or growing much more slowly since the collapse in natural gas prices in late 2011. The Baker Hughes rig count is down by over 10 percent since its peak two years ago. The result for Houston-based oil and gas employment has been that the growth of jobs in oil production, oil services, fabricated metal, and machinery has shrunk from a 15 percent annual rate to nearer 2-3 percent. See Figure 2.

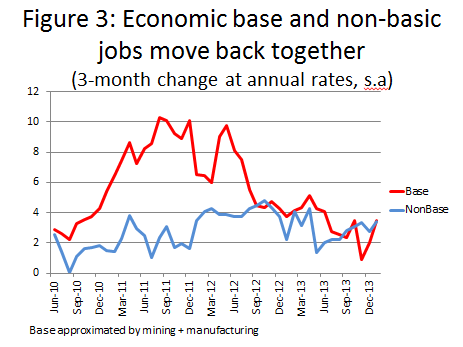
Economists also like to divide employment into basic and non-basic jobs. Basic jobs are those that drive growth by selling their products outside the 10-county metro area. The most obvious examples in Houston are energy related – oil services, oil production, machinery, refining, and petrochemicals. The non-basic jobs are followers that rely on base expansion for momentum, and are inherently local activities like laundries, dry cleaners, restaurants, and most construction and real estate. We don’t get rich taking in each other’s laundry or by building each other a new house or office building. Figure 3 shows the growth of base employment (proxied by mining and manufacturing) pulling back to rates near 2 or 3 percent, and the non-basic jobs are now falling into a similar trajectory. We know that over the long-run, basic and non-basic jobs will grow at the same rate.

In summary, the newly benchmarked revisions: 1) moved 8,800 jobs back to 2012 and, 2) showed 2013 job growth that was slower than previously thought, with 76,200 new jobs measured December to December. The data also show a rapid and sustained slowdown in basic employment led by upstream oil and gas. Our spring symposium on May 22 will be a search for a replacement for the momentum lost to this pullback in upstream E&P spending. We think the prospects for Houston remain solid, but we will rethink the current 2014 forecast of 64,000 jobs after looking closely at the petrochemical expansion underway on the east side of Houston, improved prospects for the U.S. economy, and a variety of other factors. Can one or more of these economic drivers step forward while Houston’s upstream sector steps back?
Written by Robert W. Gilmer, Ph.D.
Director, Institute for Regional Forecasting
March 10, 2014