Houston Updates
-
Archive
- June 2025
- March 2025
- December 10, 2024
- September 14, 2024
- May 21, 2024
- March 19, 2024
- December 9, 2023
- June 16, 2023
- April 6, 2023
- March 17, 2023
- Dec. 19, 2022
- Sept. 14, 2022
- July 4, 2022
- March 27, 2022
- March 9, 2022
- September 2021
- April 2021
- March 2021
- September 2020
- August 2020
- June 2020
- April 2020
- March 2020
- January 2020
- December 2018
- June 2018
- March 2018
- February 2018
- January 2018
- September 2017
- September 2017 Post-Hurricane
- June 2017
- March 2017
- January 2017
- September 2016
- March 2016
- December 2015
- September 2015
- June 2015
- March 2015
- December 2014
- June 2014
- March 2014
- November 2013
- September 2013
Possible Implications of $100 Oil for Houston: The Return of Boom Times Will Be Harder Than You Think
March 9, 2022
As this is written, the Russian invasion of Ukraine continues with a massive disruption of global commodities. In 2020, Russia ranked as only the 12th largest economy in the world or about the size of Italy, and its on-going aggression stems largely from a military of a million active-duty soldiers and its nuclear arsenal. Military aside, however, it also carries significant economic clout as a major producer and exporter of commodities, including wheat, gold, nickel, palladium, aluminum, and steel. It perennially ranks in the top three among the world’s oil producers, and Europe’s dependence on Russia’s natural gas pipeline system provides it with meaningful political leverage.
Over the longer-run, the rich supply of natural gas in the U.S. can offer reduced European dependence on Russia through LNG shipments. However, it is an expensive and long-term option for Europe that is made painfully necessary by current events. It will be good for the supply and processing base in gas-rich Texas and Louisiana if federal permits and licenses are forthcoming after the current crisis passes.
What about $100 oil? What does it mean for U.S. producers? And for Houston? The $100 beginning mark requires some discussion in the wake of decades of inflation. More important, the American fracking industry is not what it used to be. After three successive waves of oil downturns and producer bankruptcy in 2014-16, 2018-19, and 2020, a smaller and chastened American oil industry has emerged with a new financial perspective. So far, the industry has been extremely reluctant to chase higher oil prices at all, much less buy into a sustained multi-year commitment to oil prices at $100. It is unlikely that $100 oil will ever again mean what it once did to the industry -- or to Houston’s economy.
Sorting Out the $100 Oil Price
The history of $100 oil is immediately associated with long and enduring oil booms. First, this requires above all that the price of oil stay high for a long period of time. Let’s take a minimal standard of the price staying above $100 for at least two quarters. Further, as we look back over long periods back to 1973, we need to take inflation into account. Let’s use the U.S. consumer price index, rebase it to 2021 dollars, and ask when and how often we have seen $100 oil.
Since 1973 there have only been three such periods: the Iranian Revolution and its aftermath in 1979-82, the BRIC commodity boom in 2007-08, and a period of strong global growth from 2010-14 that continued after the Great Recession and pushed price up sharply. This latter period was helped along by continued and aggressive price support from OPEC. Adjusted for inflation, we see prices that have averaged $113-$136 for several quarters and peaked as high as $148 in a single 90 day period.
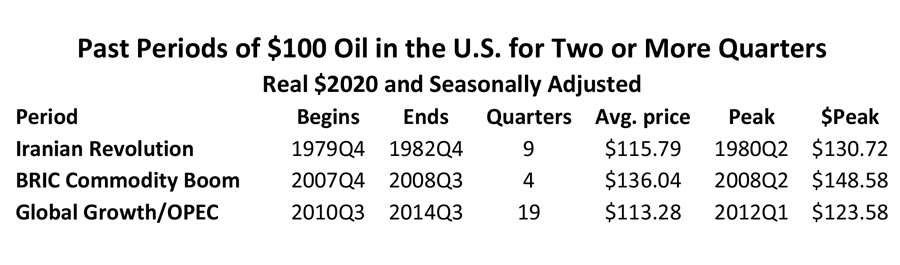
Each of the periods did bring a substantial increase in the U.S. rig count and domestic oil production. But just a few days into the current invasion of Ukraine and before the shooting stops, it is premature to assume that the price of oil will be over $100 per barrel looking three months into the future. In a global economy that is just recovering from the COVID recession, we need Russian oil to flow again. A prolonged embargo probably hurts the U.S. and Europe as much as Russia. Further, even if the U.S. and Europe were to refuse to buy Russian oil there are other large purchasers like China that would quickly step in at the right discount. Otherwise, it is an easily transported and fungible commodity that can easily leak into world markets in substantial quantities.
A New Financial Model for Fracking
If inflation provides one perspective on the potential economic impact of $100 oil, so does the current state of the U.S. fracking industry1. This industry is not the same industry that responded to the high oil prices of 2007 to 2014 with 2,000 working rigs. Fracking’s recent history is one of an industry that has been seriously damaged by a series of reckless investment decisions in the run-up to the 2014 fracking bust, by its continued actions after 2014 as it became clear fracking is a high-cost source of oil, and by punishing price cuts from OPEC+ to force this reality on them.
- Growth of tight oil and natural gas exploded in the early 2000s, and it has since been boom or bust for American fracking. U.S. oil production boomed at 24.6 percent annual rates from 2004-2014 as a result of OPEC driving $100 oil prices, zero interest rates from the Central Bank after 2008, and speculative excesses by both the fracking industry and those who financed it. It was an oil boom that rivaled the 1980s.
- The fracking bubble burst in 2015-16 when OPEC slashed oil prices, but it took until 2018 and rising interest rates from the Federal Reserve before the last avenue of growth was cut off from this capital-intensive industry. With oil prices hovering at $50-$55 in 2018, the industry could neither improve equity values nor earn profits.
- In 2018-19 the fracking industry saw a severe industrywide credit crunch as Wall Street and the investor community turned its back on the fracking business. The S&P Producer Stock Index was over 14,000 in September 2014, but it had fallen to near 2,400 by August 2020. It has returned to only 5,300 today. Oil services and machinery suffered even worse losses.
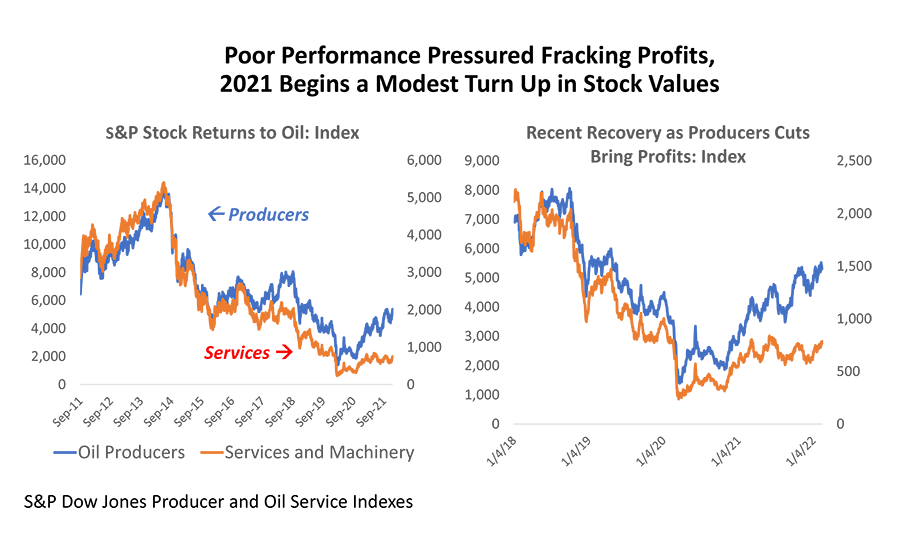
- COVID lockdowns and the Saudi-Russian oil war in May 2020 marked the low point for fracking – and posed a near-death experience for many companies. The rig count briefly fell as low 270 working rigs, down from 2000 in 2014, and has only recovered to near 600. The 2014, 2018-19, and 2020 reversals took $300 billion oil producer, oil service, and machinery assets through the bankruptcy courts.
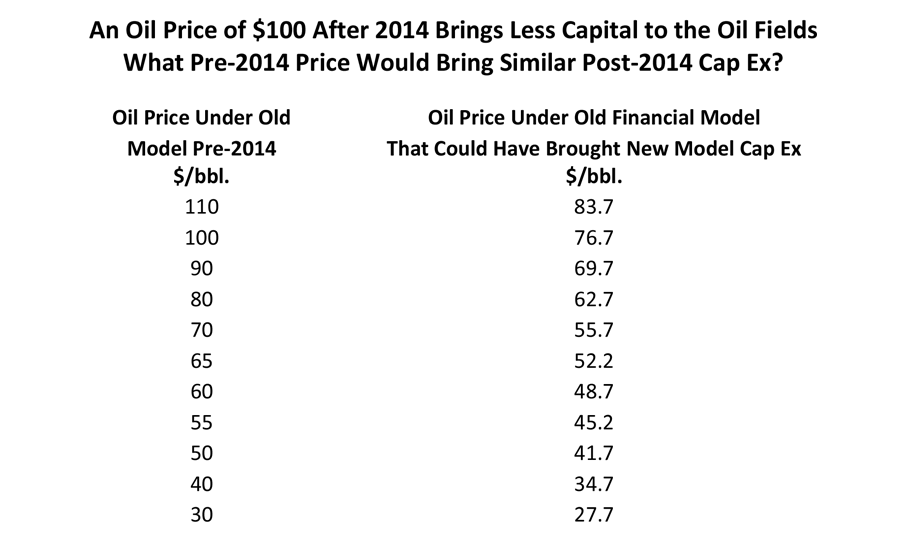
- Before 2014 the fracking industry – with the support of $100 oil – was a high-flying growth stock. All of its free cashflow could be directed to the oil fields and new production. Today a smaller and chastised industry is a value stock that can attract investors only by committing 30% or more of it free cashflow to investors through dividends or by rebuilding its balance sheet. This means a smaller and more slowly-growing industry, and that any given oil price brings a much smaller impact in the oil fields than in the past.
- How much smaller? Given the new financial model, how would the industry respond today to a WTI market price $100 oil? We know that the capital diverted to the oil fields under the new financial model will be much less than before. Let’s ask the following “what if” question: Once we see the new lower capital spending, what if we had been working under the old model? Back in 2014, what could have delivered this new lower level of capital? Read the table below and interpret it as saying that what $100 oil delivers today as oilfield spending could have been bought for $76.67 under that old financial rules. For $65 oil, think of it today having the same impact as $52.70 would have back in the old days.
Industry Response to Higher oil Prices?
It is mixed news. The $100 barrier for oil prices has been met and substantially exceeded three times for periods ranging from four to 19 quarters. These are the circumstances that offer opportunity to oil producers for substantial profits and expansion. But at the same time, we know that U.S. producers were left shell shocked by events in 2020 and have adopted a new financial approach that leaves that $100 oil meaning much less expanded activity than before. But higher prices are always good for the producer. When they see $70 oil today, they now have $55.70 worth of impact on drilling.
Will they respond now? The American oil producer has remained very reluctant to move forward. Oil prices have registered monthly averages of $70 or higher for the last six months, with only slow progress in drilling. They have been reluctant because of COVID shock and uncertain global oil demand, because of their own poor financial position, and because many U.S. producers committed to not increasing production until all OPEC excess reserves had been absorbed. They were certainly unwilling to get sucked into another $100 per barrel oil venture that could lead to one more short-lived mistake.
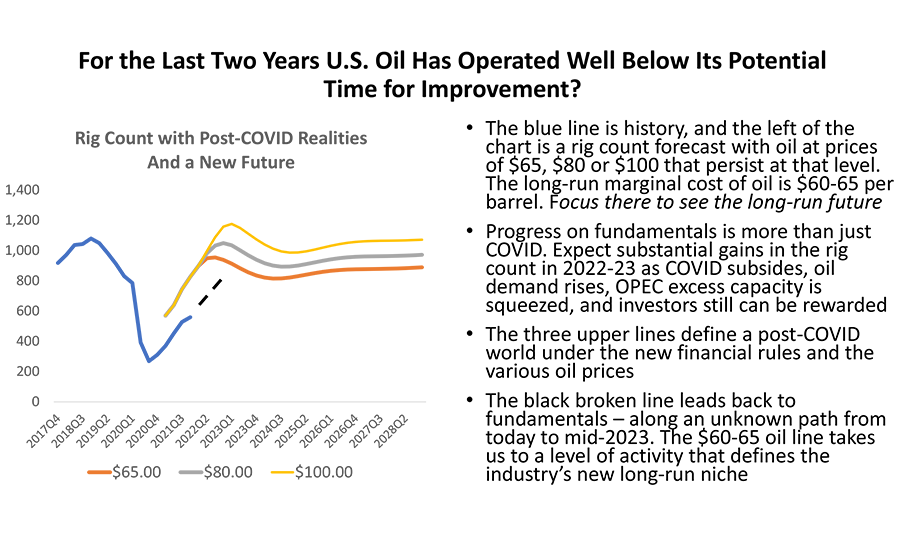
Much of this has been fixed now with COVID disappearing, great progress in financial repair, and both Saudis and Russians struggling to meet quotas earlier this year. The blue line in the Figure below is the recent history of the rig count. The red line (based on some back-of the envelope calculations) is where U.S. drilling would be if a $65 price prevailed, the new financial model were imposed, and in place of a COVID/Saudi-Russian Oil War, we had simply seen a run-of-the-mill period of $40 oil for two quarters accompanied by a serious U.S. recession. This is the world we knew it in 2019, and the $65 price described the industry’s new long-term niche in world markets.
With Omicron in retreat and normal or better oil prices, we should be capable of moving back into this pre-COVID world and onto the higher “pre-shock” lines. At $65 oil, for example, we could move back to a rig count near 800 instead of 600, and a prolonged period of $100 oil might bring a 1000 working rigs. How fast this happens and how far we really move is open to debate – but the potential for improvement has returned. Even at $100, this is not a return to the 2000 rigs of 2014, but it offers a chance for substantial improvement over the current 600.
This works for local oil-related employment in Houston as well. Even with the financial model in place, there is ample room to move forward with hiring. The latest decline in oil jobs began in 2019Q2, well before COVID and with upstream job losses reaching 36,900 by 2020Q42. We had returned only 9,200 of these oil jobs by 2021Q4 or 25 percent. If we follow the rules above for rigs – new financial model, $65 oil, COVID/oil shock wearing off, producers willing to move forward – we could see the return of 31,000 jobs by the end of 2024 or all the losses since 2019 and 3,500 more. If $100 oil prices prevailed for three years and if producers bought fully into the durability of the $100 price for three years, we could add another 20,000 jobs by 2024Q4. At best, both assumptions about $100 oil are highly speculative at best while we wait for the end of a hot war in Ukraine and can sort out the results.
$100 Oil and the Houston Economy?
Fracking will be a smaller and slower-growing industry over the coming years. It may be surprising that a new financial model from a single industry could influence the economic outlook for a major metro area like Houston with 7.1 million people and 3.2 million payroll workers. But since Spindletop oil has had a special and outsized role in the local economy. Houston payroll employment has grown at 2.0 percent per year since 1990, and 0.6 percentage points or about one-third of that growth stems from oil. The new financial model probably implies that 0.2 to 0.3 percentage points of oil’s contribution to job growth in Houston may now be permanently lost to fracking’s financial problems. These are not temporary losses to recession or a global oil crisis, but semi-permanent losses as the fracking industry buckles down for years of financial stringency.
But even if oil were to disappear from Houston tomorrow, the other contributors to Houston’s growth – the U.S. economy, demographics, the Texas Growth Formula – remain healthy over the long run, and Houston’s job growth would outperform the rest of the country 1.4% to 1.1%. However, if we add back the now-smaller contribution from oil, the comparison is 1.7%-1.8% growth locally to 1.1% for the U.S. These are still impressive results but require local belt tightening compared to previous expectations.
The table on payroll employment carries this reduced role for oil in Houston forward to payroll employment by forecasting annual new jobs to 2025 based on oil prices of $65, $80, and $100 per barrel. The rules we discussed earlier for future oil jobs once more apply here (no COVID shock, producers willing and financially able to move forward, etc.), along with an on-going recovery in the national economy that slowly returns to trend growth after COVID. At $65 per barrel we would expect to see local payrolls slowly return to its trend as well.
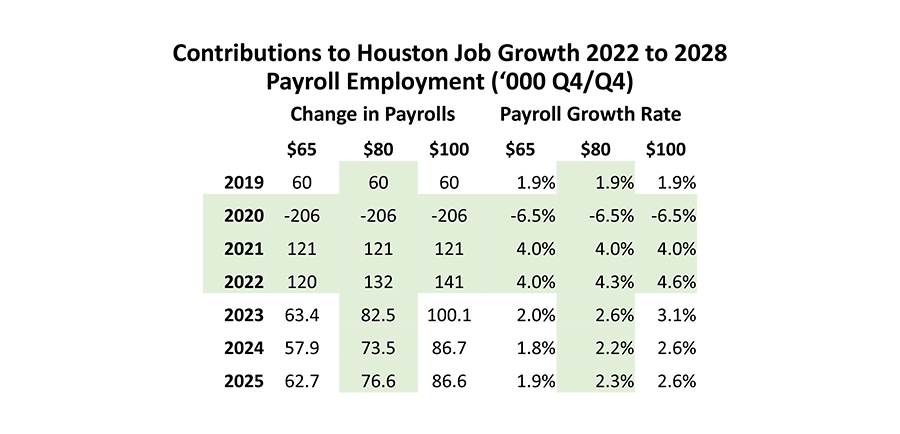
Although energy job growth helps out, the very strong 120-141 thousand payroll growth in 2022 is built less on oil prices and much more on the on-going return of large numbers of COVID-lockdown job losses in both Houston and in the U.S. Locally it takes until the third quarter of this year to finally return to pre-lockdown levels of employment in Houston. Oil prices at $100 would gain traction slowly and takes until 2023 before we finally see the substantial job gains from today’s oil crisis really begin to bear fruit.
Remember these new jobs are built on high prices must persist for several years. It is simply too early in current events to know if such gains are likely or even possible. And we must see a fracking industry that is again willing to buy into large and on-going increases in drilling and production. For now, these $80 and $100 figures present only the hypothetical implications of what a smaller and financially responsible fracking industry might deliver.
Written by:
Robert W. “Bill” Gilmer, Ph.D.
Director, Institute for Regional Forecasting
March 9, 2022
University of Houston
C. T. Bauer College of Business
1 We have produced several recent reports and presentations with detailed discussion of the recent problems and dilemmas now faced by the U.S. fracking industry, including “Oil Picks Up the Pieces After Economic Shock: Recovery Now Begins for Oil Markets and Houston, Institute for Regional Forecasting, September 2020 https://www.bauer.uh.edu/centers/irf/houston-updates-aug20.php; and Adriana Fernandez and R.W. Gilmer, “Houston and the Future of American Fracking,: March 2021, https://www.bauer.uh.edu/centers/irf/houston-updates-mar21.php
2 Upstream employment is defined here as producers, oil services, machinery and fabricated metals.