Houston Updates
-
Archive
- June 2025
- March 2025
- December 10, 2024
- September 14, 2024
- May 21, 2024
- March 19, 2024
- December 9, 2023
- June 16, 2023
- April 6, 2023
- March 17, 2023
- Dec. 19, 2022
- Sept. 14, 2022
- July 4, 2022
- March 27, 2022
- March 9, 2022
- September 2021
- April 2021
- March 2021
- September 2020
- August 2020
- June 2020
- April 2020
- March 2020
- January 2020
- December 2018
- June 2018
- March 2018
- February 2018
- January 2018
- September 2017
- September 2017 Post-Hurricane
- June 2017
- March 2017
- January 2017
- September 2016
- March 2016
- December 2015
- September 2015
- June 2015
- March 2015
- December 2014
- June 2014
- March 2014
- November 2013
- September 2013
For Better and for Worse: Oil Industry Still Drives Houston’s Economic Outlook
December 16, 2014
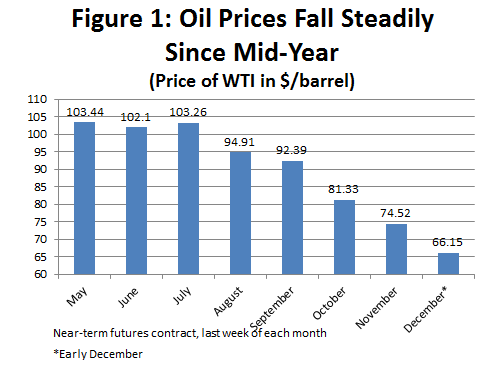
Houston's economic outlook is again firmly in the hands of the oil industry, and this brings good news and bad. The good news is that the east side of Houston is gripped by a major construction boom for petrochemicals and other energy infrastructure. Built as it is on a premise of cheap natural gas, this boom seems sure to continue and increase in size over the next couple of years. The bad news is that the price of oil has recently fallen below $60 per barrel, and these low prices promise significant cuts in domestic oil exploration and drilling. (Figure 1) These cuts will be felt from Houston’s machine shops and factories to its office towers. The question becomes how this strange mix of good news and bad balances out to affect Houston’s economic prospects in 2015 and beyond.
In the last 25 years, we have not experienced greater uncertainty about where the Houston economy is headed. What are Saudi Arabia’s intentions regarding the price of oil? Do they really have a goal of pushing Texas and North Dakota into the role of swing producer in global oil markets? Now that oil prices have fallen sharply, how will the industry react? We have not been through a downturn like this one, with decisions guided by the new economics of horizontal drilling and fracturing. Can the construction boom in Houston’s petrochemical complex provide shelter from the drilling cutbacks? How much shelter can these temporary, blue-collar jobs really provide?
In the face of great uncertainty about what path Houston’s economy might follow, this article engages in some scenario writing – a couple of simple stories about what might happen in coming months, and illustrating the consequences of these events on local job growth. These stories assume moderate to heavy cuts in exploration and production expenditures, and that the chemical construction boom proceeds at different rates. Both the scenarios show continued job growth in Houston, but only with substantial help from both chemical construction and a healthy US economy. We also raise some important questions about how the results of these scenarios split Houston between a booming blue-collar east side of the metro area, and a white-collar west side that will probably bear much of the pain.
Saudi Intentions
Oil price has fallen steadily over the second half of 2014. Although the Saudis have not articulated their rationale for promoting a low oil price, or at least for passively accepting a low price, their strategy has emerged as one of helping their friends and punishing adversaries. The friends they help include the US and Europe. The weak European is particularly important to the Saudis, and low oil prices work to stimulate what has become their most important market. The adversaries that suffer include ISIS, Iran, and Russia, as well as OPEC’s usual collection of cheaters such as Venezuela and Nigeria.1
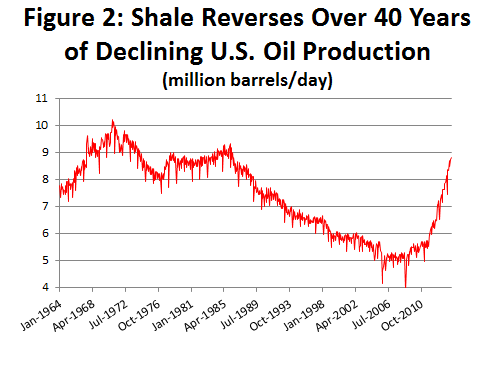
If the US is a friend and beneficiary of low oil and gasoline prices, Texas and North Dakota probably make the Saudi list of enemies. These states are home to the three great American shale oil plays — the Bakken, Eagle Ford, and Permian Basin. Figure 2 shows the surge in US domestic oil production since 2010, largely led by the shale boom that has reversed 40 years of declining American oil production. It has moved the US into third place as a crude oil producer, just behind Saudi Arabia and Russia, and if condensate and other liquids are counted, the US is number one. We have reduced the import of crude and petroleum products to about 33 percent of domestic consumption, reaching the lowest share since 1985.2
Since the 1970s, the Saudis have assumed the role of swing producer in global oil markets, stabilizing oil prices by increasing production when prices move too high, and cutting their oil production if crude price fall too far. The surge of relatively high-cost crude produced by the US apparently has forced a rethinking of this strategy: Is it better to cut production and protect price, or to allow prices to fall and protect a dwindling market share? It might cost $65 per barrel to produce oil from the deep waters of the Gulf of Mexico or from US shale, while it costs $6-$8 in Saudi Arabia. Why not make the high-cost US producer bear the burden of cutting production? It is a messier process than the centralized decision-making in Saudi Arabia, but potentially just as effective. Low prices bring less cash flow to US producers, and force capital spending cuts; high-cost producers are driven out of the business; fewer wells are drilled, and production ultimately falls. There are potentially many layoffs and a few corporate failures along the way, but production falls and higher prices are restored over a period of months. And it makes US shale production a cyclical industry – down with every oil surplus, up only as oil prices rise.
This outcome of this confrontation depends on how much exploration and production will be cancelled as crude price moves from $85, to $75, and $65 per barrel. Can the US shale producer outlast the deep pockets of Saudi Arabia’s Aramco and a $700 billion sovereign fund? The Saudi government — depending on $90 per barrel to balance the public budget — will find this a painful experience as well.
Cheap Oil Meets Cheap Natural Gas
Oil price is critical right now in determining the capital spending for exploration and production (E&P) by the American shale industry. The price of domestic natural gas collapsed in late 2011 in the face of high volumes of new gas production from shale, with the fall helped along by a weakly growing US market. About 600 rigs were pulled away from gas-directed drilling, and the rig count fell by 15 percent. By 2012, eighty percent of US drilling was directed to oil, and the bulk of the US shale boom was left resting on the price of crude.
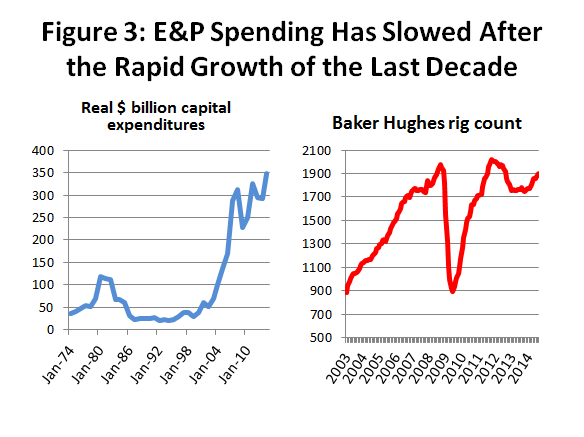
Figure 3 shows that current inflation-adjusted expenditures for E&P have tripled since the 1982 peak, the previous standard for a massive expansion of the oil industry. Between 2003 and 2008, the real domestic E&P spending rose at compound annual rates of 35 percent per year. This rapid growth was broken by the financial crisis in 2009, then again by the 2011 fall in natural gas prices, but E&P spending remains at very high levels. In 2014, producers seemed to put behind them any negative thoughts left from the financial crisis or low natural gas prices, and pushed strongly back into the oil fields. By late 2014 the fracking fleet of US oil service companies was sold out, and expected to remain fully engaged through 2015. The shale oil boom was set to continue strongly – until the price of oil began to slip quickly last fall.
How will the industry react to lower oil prices? We did experience a major downturn in E&P expenditure and oil industry employment in 2008-2009, but that event also included a major financial crisis and the worst recession of the last 75 years. A recent survey of about 100 oil producers by investment house Tudor, Pickering, and Holt might be characterized as telling us that E&P growth would certainly slow as price fell below $80 per barrel, and would likely be reversed below $75. Only 4 percent of respondents indicated that the price they used for forward drilling plans was less than $75, and 75 percent said they would be trimming their drilling plans at $75. As price dips below $60 dollars per barrel – levels not even contemplated by this recent survey — substantial cuts in capital spending seem to be in the offing.
Meanwhile, in east Houston, a major construction boom is underway based on cheap natural gas. Although a wide variety of projects are underway, with some responding to new infrastructure and energy processing needs from the shale boom, the focal point of the expansion is petrochemicals. In contrast to a refiner – who produces oil products such as gasoline or jet fuel – the petrochemical producer in North American uses natural gas liquids to make intermediate products that become plastics and synthetic rubber. For example, the natural gas liquid ethane is processed into the petrochemical ethylene, which then is used to make plastic such as polyethylene or polyvinyl chloride. Outside North America, these plastics are made with oil-based feedstock priced in recent years at $100 per barrel: meanwhile, our natural gas liquids were priced like natural gas at $4.00 per thousand cubic feet, or the oil-price equivalent of $22 per barrel. The result was enormous competitive advantages for the North American ethylene producer from low natural gas prices, and it has set off a race by many companies to enter or expand their presence in a highly lucrative market.
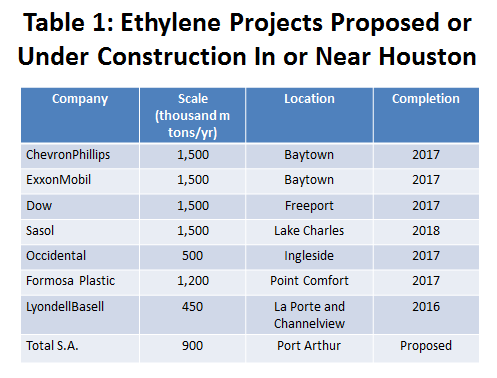
Table 1 summarizes eight ethylene plants that are proposed or under construction for the Gulf Coast region between Corpus Christi and Lake Charles. The large projects on this list, together with the downstream plastics plants associated with them, will each have a price tag near $5 billion dollars. Thousands of workers will be on site as each construction project reaches its peak. A recent assessment by Goldman Sachs (published with the price of oil near $60) put the prospects of completing the Baytown, Freeport, Ingleside, and Point Comfort plants at 100%, and Sasol’s Lake Charles plant at 75 percent. The reports points out that for many other projects that have been proposed, but are which not far advanced, we are likely to see slowdowns and cancellations.3
LNG plants are another major source of regional construction activity, built to liquefy and export natural gas. North American natural gas today cannot be exported to Europe or Asia, and the large quantity of shale gas trapped here is a major contributor to weak natural gas prices. Two plants have completed the multi-agency permitting process (at Sabine Pass and Freeport), and several more are expected to be built in North America. With a construction cost of $10 billion each, these projects are again major sources of work for the Gulf Coast, including the Houston region.
This construction boom is built on low natural gas prices, and the problems that low oil prices pose upstream should not be a broad threat to this construction. In some cases, where high production levels of liquids justify the project – such as export facilities for propane, butane or ethane – there might be a need to rethink future supplies in a time of production cuts. But the ethylene and LNG expansions seem likely to continue. In the past, US ethylene has been built for domestic production, and was only exported opportunistically. The current plants are built as export platforms based on significant cost advantages over foreign producers. Margins may be squeezed now, but looking forward, no one expects the price of oil to remain below $60 for a prolonged period. Ethylene feedstock priced at a conservative $7 per thousand cubic feet, and oil at $80 per barrel, yields a competitive advantage of natural gas over oil that continues at roughly $40 per barrel.
Counting up Local Jobs
Until recently, the energy industry found itself in the unusual situation of facing high oil prices and low natural gas prices. High oil prices set off a shale-based exploration boom; low gas prices inspired a huge surge in building or expanding infrastructure and processing capacity downstream. Until this fall, it looked like the story of the Houston economy for 2015 would shape up as a major collision between competing resource demands within the oil industry – a race between upstream and downstream to tie up blue-collar construction skills and machine shop capacity. Now the more likely question for Houston will be: How well can the downstream construction boom substitute for job losses in the E&P sector?
How should we count up new jobs in Houston? New jobs are created locally by broad trends in US growth or by the expansion of the local oil cluster. Over the very long-run, probably about half the jobs in Houston are created by the national economy and half by the oil industry. Houston’s oil-related employment currently includes about 300,000 employees of oil producers, oil services, machinery, fabricated metal, refining, chemicals, and pipelines.
Economists often describe employment, income, or production as being basic or nonbasic, depending on the industry involved. Basic employment, for example, is found in industries that reach outside the local metro area, and sell into larger regional or national markets. The oil industries listed above are perfect examples of basic jobs, using local talent to serve national and global markets from Houston. But other non-petroleum industries in Houston also tap into broader markets – wholesale trade, air transportation, and some business and professional services, for example.
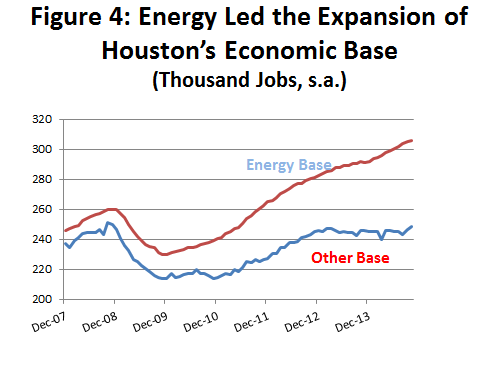
Figure 4 shows the recent level of both the oil-related base jobs and the non-energy part of the base, with about 55 percent of jobs being oil-related. Over the long-run, we might expect the two to grow at similar rates, but in recent years, the size of the shale boom has combined with weakness in the national economy to create a considerable disparity. Much of the recent surge in jobs in Houston – indeed, what has set Houston’s economic performance apart from the US economy since 2010 – has been the energy boom set off by $100 crude.
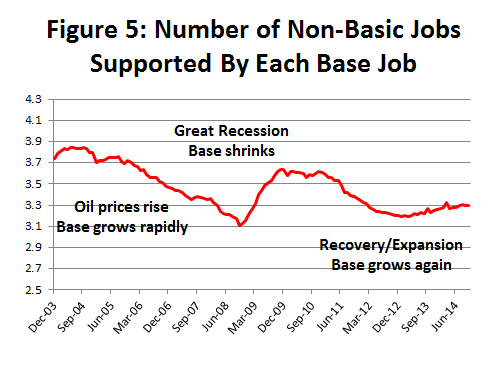
Nonbasic employment is inherently local activity that does not reach outside the metro area, and does not drive regional growth. These industries and their workers provide critical services to the community, but are dependent on base industries to create regional income and jobs. Bars, restaurants, grocery stores, dry cleaners, hospitals, real estate development, and drug stores fit this description. Figure 5 shows the number of nonbasic jobs supported by each base job in Houston, typically between three and four. Every time a new job is created (or lost) in energy or in another basic sector, another three or four jobs are created (or destroyed) in the months that follow.
Before we get into the details of various scenarios, let’s set some expectations about the rate of job growth in Houston. First, we estimate that each one percent increase in US employment will create around 33,000 jobs in Houston.4 The impact is felt over time, and the jobs arrive over a period of 8 or more quarters. In all of our scenarios, we are going to assume that the US economy continues to perform well, generating new jobs at 1.7 percent per year. This means that the annual count of new jobs in Houston always begins with a base of about 56,100 (or 1.7 times 33,000).
For the cluster of 300,000 oil jobs in Houston, a one percent expansion can create 18,000 new basic and nonbasic jobs over the following several quarters. Some quick arithmetic can illustrate how quickly swings in the oil market might affect local job growth. If we begin with 56,100 jobs from the national economy, a 3 percent increase in the oil base provides 110,000 new local basic and nonbasic jobs; a three percent decline in the oil base means 2,100 new jobs; a six percent decline in oil employment means a loss of 51,900 jobs. Clearly, things can change quickly in a commodity-based economy like Houston, and falling oil prices have important implications for local job growth.
Cuts in E&P Spending Upstream
There is great uncertainty about even the near-term level of oil prices and the response of oil producers to low prices. For our first scenario, let’s start with a 20 percent cut in E&P capital spending that works on the following schedule: a 10 percent cut in 2015Q1, followed by another 10 percent in Q2; this 20 percent reduction remains in place through Q4. In 2016Q1, E&P spending rises by 10 percent, and then returns to 2014Q4 levels in Q2. By 2016Q3, capital spending begins to grow rapidly again at 8 percent annual rates. Alternatively, consider Scenario 2, which proceeds on exactly the same schedule, but entails a 33 percent reduction in capital spending and 5 percent growth in E&P beginning in 2016Q3.
In both cases, we assume that the US economy grows at 1.7 percent. If there was no help from downstream construction (considered at length below), these cuts are sufficient to induce a mild recession in Houston. Energy-related jobs in Houston fall by 18,000 in Scenario 1, a decline of 6 percent spread over two years. In scenario 2, they fall by 23,600 or 7.9 percent. Total payroll employment in Scenario 1 would see combined losses of 50,000 jobs in 2015-16, while Scenario 2 would mean a 75,000 job decline over the same two-year period. Growth bounces back strongly in both scenarios as E&P spending picks up again in 2016.
A few very important caveats should be mentioned.
- The length and the depth of the E&P cuts are simply examples. What actually happens will depend on the recovery of the global economy, as well as the strength of will exerted by the Saudis and the depth of their pocketbook. And it will depend on the uncertain response of producers in Texas and North Dakota in cutting production.
- Statistics seek to replicate the past and extrapolate past behavior to current circumstances. We have never been through a scenario quite like this in the era of high-cost drilling. Is the past response really a good guide to the future?5
- Will the expected white-collar job cuts materialize? The huge downturn in oil markets in the 1980s left the US with a surplus of oil-related skills, and another generation of oil workers was never trained. Now the baby-boom generation is retiring, and there is a shortage of core skills such as geologists, geophysicists, and petroleum engineers. An effort to replace the retirees has been underway for several years, and companies may hoard these skills in difficult times rather than consider layoffs. Outside the core skills, however, in any support or overhead position, whether inside the energy company or as a contractor, white-collar employment will certainly be a target for reduction.6
- How fast will the American shale industry grow after an oil-shock like this? Does it simply resume the rapid growth of the past? Or does it emerge as the swing producer in global markets, looking at a highly cyclical future – ramping up production as prices climb, but cutting back and winding down production every time surplus oil emerges on global markets?
Downstream Construction Boom
So far, Scenarios 1 and 2 considered substantial cuts in E&P, but not the downstream spending that is expected to continue and grow to high levels on the east side of Houston. Downstream spending is often neglected in terms of its economic impact of the oil industry, mainly because it is usually small compared to the upstream. Spending on refining and chemicals is mostly focused on the Texas and Louisiana Gulf Coast, but often the projects have more meaning to the Baytown or Deer Park economy than to the broad Houston metropolitan area. That is certainly not the case right now, as the expansion of shale-related infrastructure, chemicals and liquefaction plants has created a boom of unprecedented size and scale.
The east-side construction jobs should be considered as part of Houston’s energy base. We want to create a couple of downstream scenarios that include estimates of the number of construction workers associated with these projects. We will then ask how well this construction might offset the loss of basic employment due to E&P cuts.
- We began with an assumption of very large industrywide capital expenditures for shale-related projects. About $90 billion will be spent for shale-related petrochemical plants, or for other basic processing or transportation-related infrastructure. Another $50 billion would be spent for LNG plants in the US. Petrochemical work began in 2014 and continues through 2018, peaking in 2015-16. LNG construction peaks in 2016-17.
- Statistical analysis found a consistent relationship between Houston construction employment and the level of domestic downstream spending. A one percent increase in the industry’s downstream capital expenditure brings 145 new jobs in Houston, based on the current 200,000 local construction workers.7 This seems like a small number, until you realize that we are considering quarter after quarter of double-digit increases in capital spending. The number of workers can and does add up very quickly.
- Not all announced projects will come to fruition. For Scenario 1, we assumed an attrition rate of one-third percent for these projects, and reduced the number of local workers accordingly. For scenario 2, we assumed that only one-half of the projects are built. Current events may play some role in the cancellation of projects. Margins for some chemical plants may be squeezed by low oil prices, where oil is the competitor feedstock. They will be delayed or cancelled. Or some projects that are based on large quantities of future surplus liquids, like export facilities for ethane, propane and butane may need to be rethought. Generally, however, most projects should remain economic, built as they for a 30-year life, and built because of assumed low natural gas prices relative to crude long after the current oil-price decline is over.
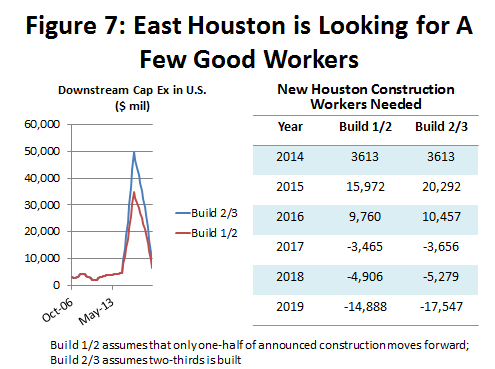
- Figure 7 shows the assumed level of capital expenditure for the two scenarios, and the projected number of local workers. The number of workers is large, but not out of line with the numbers of construction workers often cited as required for this push to build plants and other energy infrastructure. The figure also makes clear the temporary nature of construction work, building up to high levels, and then winding down just as quickly. Just as the construction workers are needed to fill in for the loss of upstream activity in 2015-2016, resumed growth in E&P is needed to fill in for the loss of construction work beginning in 2017-19.
We can think of these construction workers as substituting for job losses upstream. Building these new pants is basic activity – drawing money for construction budgets from global corporations and bringing it into the community – and the construction workers are drawn here from all over the US. We should add them to Houston’s energy base.
But do these temporary, blue collar jobs make good substitutes for the jobs lost upstream, many of them highly-compensated white-collar office workers. Looking beyond obvious differences in compensation, we saw in Figure 5 that through employment multipliers a new job in Houston’s economic base will typically support 3 to 4 more jobs.8 It is unlikely that temporary jobs that last for only 18-24 months could support much new home construction, apartments, or most retail and office space. However, the multipliers should work well enough for linkages back into the industrial, wholesale, and transportation sectors that are needed to support construction activity.
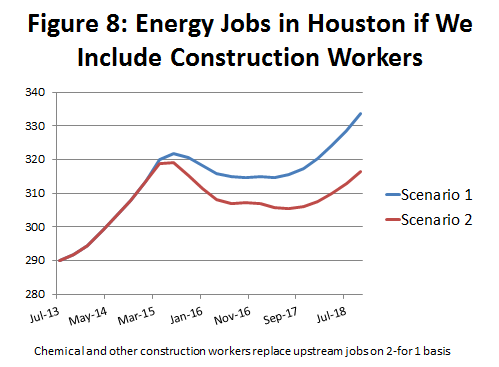
To compensate for the temporary nature of these jobs, we replaced upstream jobs in the energy base with construction workers on a 2-for1 basis – two construction workers compensate for the lost salaries and the multiplier effect of a single worker upstream. This was applied to both the expansion and contraction of construction work. Adding the energy employment losses upstream and the energy gains downstream, we come up with a new total for the number of energy jobs in Houston.
Scenario 1 assumes that E&P falls by 20 percent, and that 2/3 of construction work continues; Scenario 2 is a 33 percent cut in E&P, and only 1/2 the downstream construction work materializes. Figure 8 shows how the energy employment rises in Scenario 1 in early 2015, but then turns flat and declines with relatively small losses in 2016 and 2017. In Scenario 2 the number of energy jobs declines further and recovers more slowly, with more conservative assumptions both upstream and down. The recovery is timed differently in the scenarios because Scenario 1 assumes a resumption of E&P growth at 8 percent after 2016, while Scenario 2 assumes 5 percent. However, both scenarios strengthen in 2017-2018 as the return of strong upstream activity outweighs the winding down of construction work.
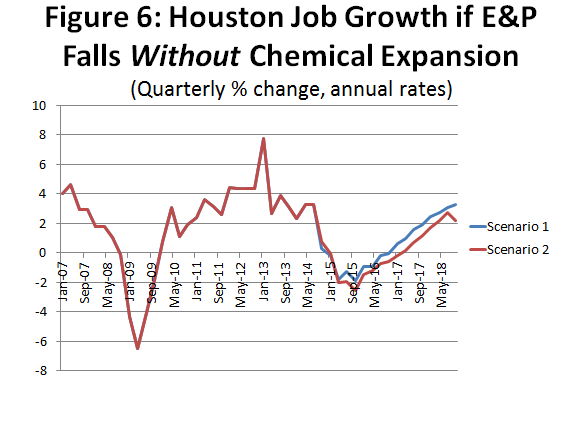
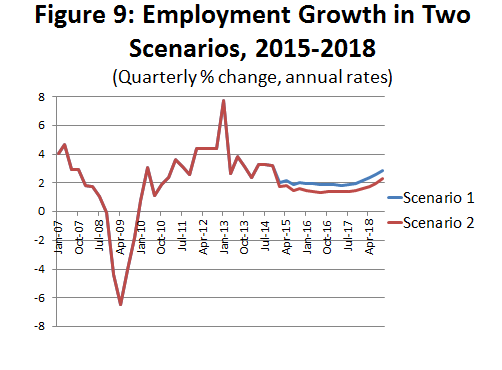
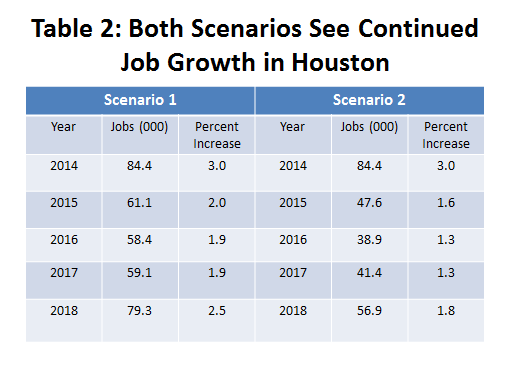
Applying these energy employment figures to a forecast of Houston jobs, we find that local job growth continues in both scenarios. (Figure 9) The number of new jobs in Scenario 1 (20 percent drop in E&P and 2/3 of construction completed) is show in Table 2 from 2014 to 2018, along with the annual percentage increases. The numbers seem disappointing in contrast to the 100,000 new jobs that Houston has averaged each year since 2011. However, given the likely damage to the upstream energy base from current low oil prices, these figures look very good indeed. Scenario 1 sees job growth that exceeds the 1.7 percent assumed for an increasingly healthy US economy. Scenario 2 (a 33 percent drop in E&P and only half the construction completed) sees job growth fall below the US growth rate but staying positive and above 1.3 percent. The combination of chemical construction in east Houston and a strong US economy keep Houston well out of recession. Look back at Figure 6 to see what happens to Houston’s economy without the chemical and LNG expansion.
Current Events
As this is written, with WTI crude prices below $60, the best guess is that we will see a substantial hit to upstream E&P in 2015, and that the downstream construction remains relatively healthy. Oil producer strategy at this point must be to cut capital expenditures, reduce wage, salary and other costs to match cash flow, and then sit it out until crude price and cash flow improve.
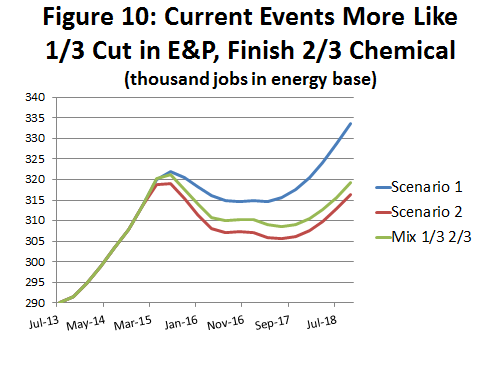
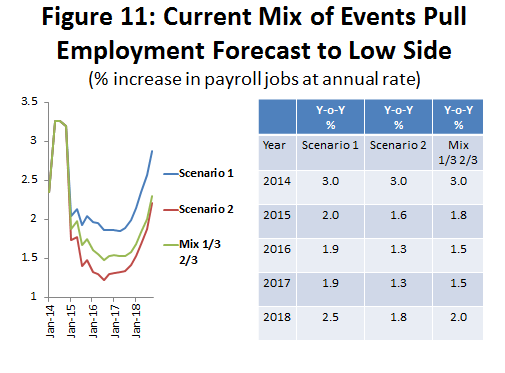
Using our scenarios, what happens if we combine a 33 percent cut in E&P with an assumption that 2/3 of petrochemical and other construction is finished? Figure 10 shows that this combination pulls the path of energy employment to the low side of the range of scenario outcomes. Conservative assumptions about the impact of construction work play a role here, replacing lost jobs upstream only on a 2-for-1 basis. Also, the 33 percent cut in E&P comes with an assumption that E&P expenditures recover at a 5 percent rate after 2016; this is in contrast to the 20 percent cut and an assumed 8 percent growth in E&P after 2016.
Figure 11 shows that the tendency of the energy base to follow the low end of the range of scenarios carries through to total payroll employment. The third column of the table on the right of Figure 11 shows the job growth associated with the scenario mix of a 1/3 cut in E&P and 2/3 of petrochemical work completed.
Conclusions
Given Houston’s dependence on oil exploration and production, there is never a good time to see oil prices fall as far and fast as they have in recent months. But if we had to choose such a time, our two scenarios indicate that this might be the moment we would have selected. The construction boom on the east side, combined with the growing health of the US economy, point to continued job growth in Houston despite the setback to E&P.
Simply working through the scenarios provides insight into the extent of the uncertainty facing oil markets, the oil industry, and the Houston economy. These scenarios should serve to illustrate how events might play out in these specific circumstances, but should not be taken as a guide to exactly how events will play out over the coming months.
We are still very early in a story that will take many months to come to an end.
Our scenarios focus on a single round of cuts in the E&P industry, and the recovery that follows. Limited damage to job growth was done in this particular case. A more disturbing aspect of this cycle is whether it might be the first of a long series of cycles to come. If US shale is moved into the role of swing producer, similar cuts to US oil production will be needed to rebalance global oil markets with every emerging surplus. The shale industry will ramp up again only when oil prices justify the expansion. And there will probably not be a local construction boom to offset the pain of these future cycles in Houston. The shale industry’s attractiveness to lenders and investors can only be damaged by this cyclical behavior, pointing to more moderate growth in the exploitation of shale over the long term than it has enjoyed in recent years.
We may look back one day at the overall statistics for job growth in Houston in 2015 and 2016, and simply see a period of moderate growth after years of out-sized performance. But the average may disguise substantial differences between the booming blue-collar east side, and the white-collar west side that will bear much of the pain. For example, a steady flow of young college graduates and professionals has come to Houston seeking an urban life style that fueled an upscale apartment boom inside the 610 Loop. This influx of young workers seems likely to be interrupted. Growth in the need for office space and high-end retail also seem likely to slow based on the income, class, and demographic dimensions of job growth in the scenarios we outlined. Industrial activity, however, whether on the ship channel or the machine shops of north and northwest Houston, will continue strongly, as cancelled projects upstream simply open a place in line for on-going chemical construction.
Notes
1 Current weak crude prices are due to a variety of causes, with US shale production only one cause. Over production by OPEC members, and heavy sales from Libya and Iran to raise revenue to fight insurgencies, have added to growing US supplies. On the demand side, there is substantial weakness brought on by recessions in Japan and Europe, along with a broad slowdown in emerging markets such as China, India and Brazil.
2 Energy Information Administration, How Much Petroleum Does the US Import and From Where? http://www.eia.gov/tools/faqs/faq.cfm?id=727&t=6.
3 The Goldman Sachs Group, Inc., The Ethane Advantage Has Evaporated: Is the SuperCycle Over? (December, 11, 2004), Exhibit 4, p.6.
4 The estimate of this elasticity is from an error correction model relating US employment and the cluster of oil jobs in Houston to local payroll job growth. Strong evidence was found for a long-term relationship to Houston total employment – working out over 6 to eight quarters -- for both the national economy and the oil cluster. Various versions of the model agreed closely on the elasticities cited here.
5 Perhaps because of the uncertainty about oil price, much of the discussion in the industry has not been about rigs counts or prices, but the percentage cuts in E&P as a result of low prices. For that reason, we used data on historical E&P expenditures, and related them to the number of basic jobs in energy. The statistical relationship was strong, showing that E&P spending has powerful short- and long-term effects on Houston’s energy employment. In the past, the analysis would have used the rig count in place of E&P, but rigs have become a less useful indicator of oil-field activity in recent years. Some industry analysts predict a decline of 500 rigs in 2015-2016. The downstream capital expenditures did not affect the number of jobs in the energy base, and was handled differently. This is discussed below.
6 There are probably only 100,000 or so white-collar jobs in the energy industry as we defined it. However, since each of these jobs support 3 or more nonbasic jobs, the cuts will reach well outside a narrowly defined energy base. Professionals in engineering, consulting, legal, accounting, personnel services, and many other categories will also find themselves as potential layoffs.
7 Total construction employment in Houston was estimated as a function of general economic trends and specific spending by the oil industry for downstream construction activity. A statistically significant relationship was found for both variables, again using an autoregressive error-correction model. Long-term estimates were similar in restricted and unrestricted estimates of differences, as well as in levels estimates.
8 For the energy base, the multiplier is even higher. We estimated above that a 1 percent (3000 job) increase in the energy base would result in 18,000 total jobs. Then the multiplier is (18,000 – 3,000)/3,000 = 5 nonbasic jobs per base worker.
Written by: Dr. Robert W. "Bill" Gilmer
Director, Institute for Regional Forecasting
December 16, 2014