Houston Updates
-
Archive
- June 2025
- March 2025
- December 10, 2024
- September 14, 2024
- May 21, 2024
- March 19, 2024
- December 9, 2023
- June 16, 2023
- April 6, 2023
- March 17, 2023
- Dec. 19, 2022
- Sept. 14, 2022
- July 4, 2022
- March 27, 2022
- March 9, 2022
- September 2021
- April 2021
- March 2021
- September 2020
- August 2020
- June 2020
- April 2020
- March 2020
- January 2020
- December 2018
- June 2018
- March 2018
- February 2018
- January 2018
- September 2017
- September 2017 Post-Hurricane
- June 2017
- March 2017
- January 2017
- September 2016
- March 2016
- December 2015
- September 2015
- June 2015
- March 2015
- December 2014
- June 2014
- March 2014
- November 2013
- September 2013
The Economic Outlook for Houston in 2020: A Credit Squeeze in American Oil and Continued U.S Growth
January 17, 2020
Expectations for Houston’s economic outlook are now lower than a few months ago, primarily due to a credit squeeze in the U.S. oil industry that has been marked by a string of highly publicized bankruptcies, mergers, delistings, and other signs of financial strain. The damage to oilfield activity unfolded quickly in the second half of 2019, pulling drilling activity down by over 25 percent.
The consequences of tighter oil credit for Houston’s economic growth so far seems to be isolated to a moderate slowdown in 2020 payroll employment growth that could subtract 10-15,000 jobs from 60,000 new jobs that might have been expected before the deterioration of credit. Employment growth at this rate assumes that moderate expansion continues in the U.S. economy. Although we will likely see a smaller American oil industry emerge in coming years, we don’t yet foresee serious consequences for Houston’s long-run growth rate.
Much of this economic outlook for 2020 was the product of our November Economic Symposium. The need to update it – after all, November was not so long ago – says much about the credit crunch now affecting the oil industry and the speed with which it has moved. It also says much about our ability to foresee these events.
Expected changes to the Houston outlook remain modest, but the recent bankruptcies and delistings have provided dire and scary headlines that need to be addressed with care as we look forward. Our bottom line is that while recent events are serious for the fracking industry, they are likely to prove less serious for Houston’s economic outlook. (https://www.bauer.uh.edu/centers/irf/docs/Fall-2019-Symposium-Final.pdf)
Credit Squeeze Grips the Fracking Industry
The industrial structure of the new fracking industry sets it well apart from the history of American oil. From the days of Standard Oil, the industry was dominated by a few large global operators like Shell, BP, Exxon, or Chevron. These were large multibillion-dollar companies that conducted billion-dollar projects over a period of years. Although we will find some of these large companies heavily involved in the new fracking business, they are joined by many small operators that give the industry a highly competitive feel.
The U.S. fracking industry was conceived and mostly developed by smaller companies, and low barriers to entry still provide a continued flow of new operators if profits are high enough to tempt them. The companies can quickly ramp production up or down based on changes in the price of oil. Unlike conventional oil, there is virtually no exploration risk in and oil production that closely resembles manufacturing in its short delivery time and certainty of delivery.
Fracking is, however, a relatively high cost source of oil, and along with Canadian oil sands it is probably the swing producer in today’s map of global oil resources. As oil prices recently fell back from $60-$65 per barrel, the marginal barrels from fracking quickly began to be squeezed out of production. The 2019 oil prices near $55 a barrel and natural gas prices near $2.50 per thousand cubic feet put substantial financial pressure on many of the industry’s less efficient fracking operators.
While low oil prices are one source of the current wave of bankruptcies, delistings, mergers and other signs of financial distress that have swept through the industry in the last six months, credit availability has also played a role. The U.S. fracking industry began to reshape American oil production in 2011 based on modest technical innovation, extensive U.S. hydrocarbon resources with favorable rules for development, oil prices that averaged $95 per barrel from 2011 to 2014, and cheap money steadily delivered by the central bank. There is little doubt that many of the new fracking producers were never conceived as long-term enterprises, but as a short-term speculative play. The key was low-cost borrowing, high leverage, and rapidly rising equity values.
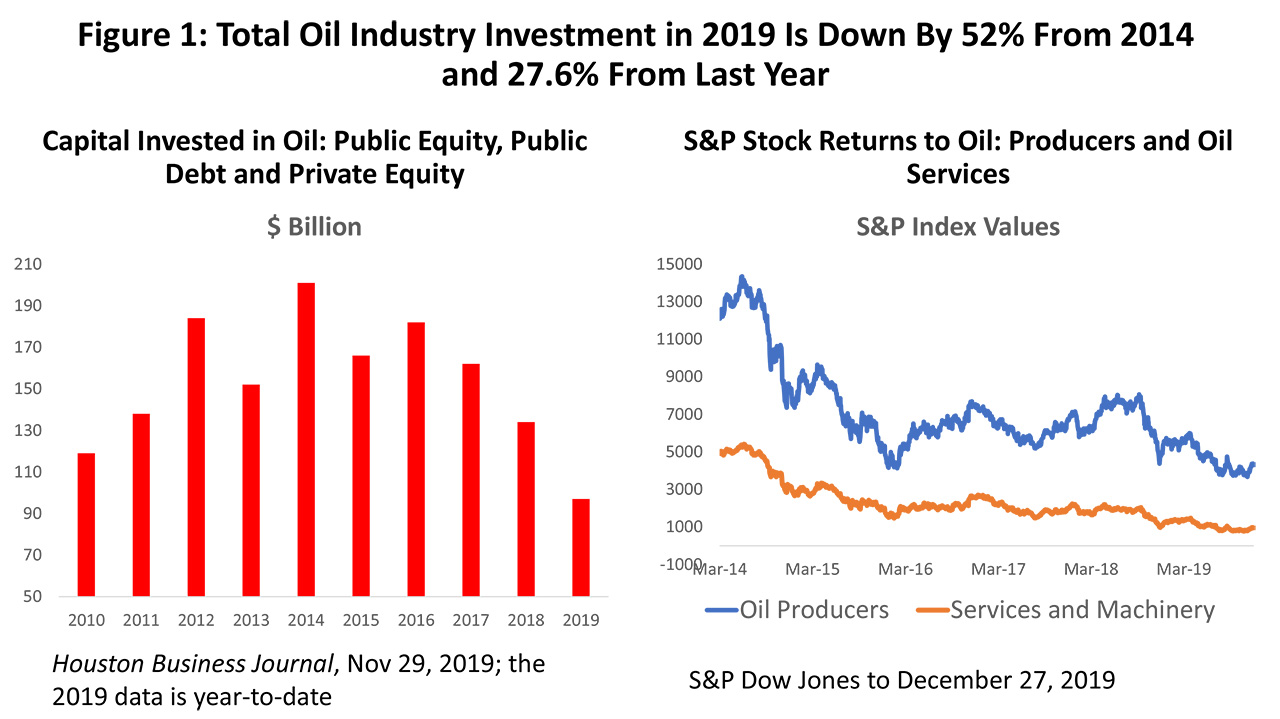
The tide of cheap money for fracking has clearly ebbed, and Wall Street has turned its back on those companies that have failed to deliver either speculative success or solid earnings. Figure 1 shows the total investment in the oil industry from public equity, private equity, and public debt since 2010. The combined annual investment has fallen by over half since 2014, and by over a quarter since just last year. The right side of the chart shows the performance of energy stocks listed on the S&P 500 for both producers and oil services and machinery. Current values of the producer index rival the worst moments of the 2015-16 oil downturn, and the index for services is much worse. The combined value of all the oil-related stocks listed on the S&P 500 recently fell below the value of Apple.
Without adequate equity returns or earnings, many fracking companies have seen the onset of major credit issues. Lenders respond by tightening credit standards that were too loose for too long, and often overcompensate by raising standards too high and leaving only the most credit-worthy with access to funding. Symptoms of the credit crunch abound. The most obvious is bankruptcy, where in some cases we see equity holders wiped out and recapitalized by the debt holders. In other cases, bankruptcy becomes a strategy to shed debt, recapitalize, and clean up the balance sheet. In neither case do the underlying assets disappear, but are simply revalued, repackaged, and put to work under different ownership.
The recent history of oil and gas bankruptcies is described in Figure 2, based on the number of bankruptcies and the combined value of the collateralized and uncollateralized assets at stake. The 2019 data is available for only the first three quarters, but so far, the number of producer bankruptcies is up from 28 to 33, and the value of debt at risk is slightly lower. Certainly, current events to this point are in no way comparable to the damage done by low oil prices in 2016.
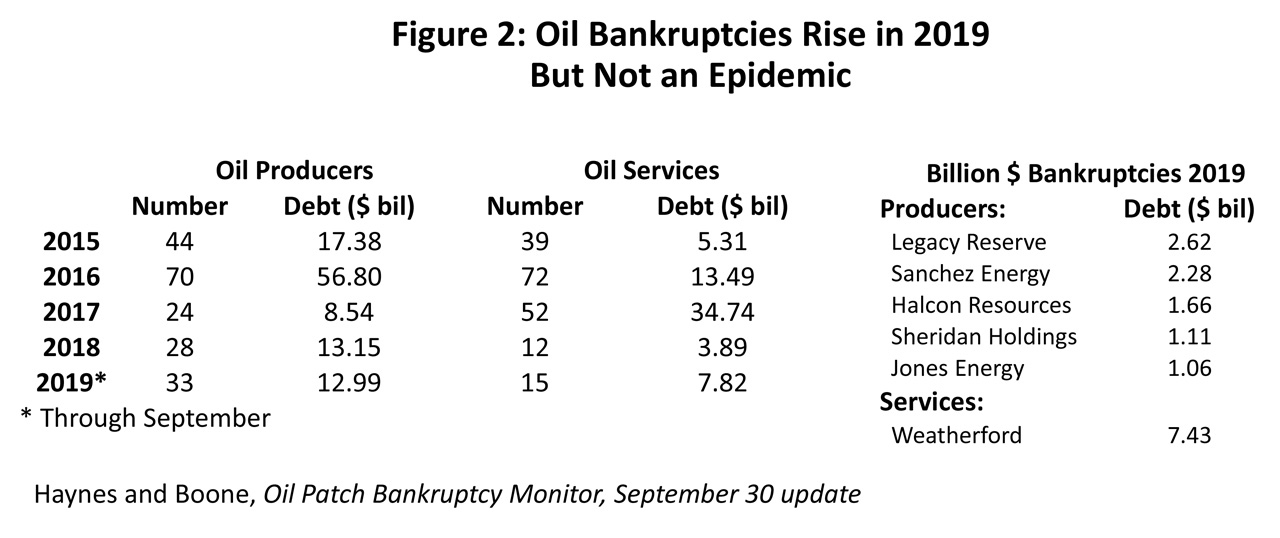
The story is similar for oil services and supporting industries to the extent that there is no surge in the number of bankruptcies, but there is a very substantial increase in the value of bankrupt assets. It turns out that 95.0 percent of the oil service assets at risk under bankruptcy belonged to one company – Weatherford. Weatherford is the fourth-largest oil service company, and after making a series of bad bets through past mergers company reorganized emerged from bankruptcy in December. Again, there is no fair comparison of what is happening now in the industry to the events of 2016-17.
There is the no question that signs of financial stress remain common and continued into the fourth quarter. Bankruptcies were still mounting (Approach Resources, Newsco, International Services, EP Energy), even as some larger companies like Weatherford and Halcon Resources emerged from bankruptcy. Key Energy Services and McDermott actively negotiated forbearance with debt holders. Pacific Coast Oil, Synthesis Energy, Key, Pumpco, and High Crush all received delisting warnings from their respective exchanges, and Stabilis Energy was delisted by NASDAQ. Chesapeake, a large natural gas producer, issued a warning that low gas prices put its financial future at risk.
This bad news at least indicates that progress is underway in cleaning up in the aftermath of the credit mess. But there is good news as well. There are strong and successful operators in the fracking industry that can produce with oil prices at $30 per barrel, such as EOG, Pioneer, Concho, Exxon XTO, and Chevron. But even the largest companies are busy writing off billions of dollars of bad past investments, especially among their natural gas producing properties.
A recent study by the Norwegian consulting company Rystad looked carefully at the balance sheet of the top 40 U.S. unconventional oil and natural gas producers. Diversity rules among the group based on geography, organization, and objectives of management. Rystad found that the group was collectively under financial duress right now, but not facing a wave of bankruptcies. Even with the current severe constraints on capital, many of these companies were handling their debt well and replacing and expanding their reserve base. Most future bankruptcies would be among the industry’s peripheral producers and outside the top 40.
The severe short-term consequences of the credit squeeze are apparent, but there are longer-term consequences as well, including a smaller if more efficient fracking industry in the years to come. Fracking was literally born into an era of low interest rates and seemingly endless credit. As the industry moves to end its free-spending ways, clean up the balance sheet, and impresses stockholders with solid operations and earnings, Rystad points out that even the top 40 operators are collectively hobbled by a hangover of $100 billion in annual debt installments and interest payments over the next seven years. Even if the credit crisis ends soon there is still a high level of debt that remains for years to come.
Aggregate Consequences for U.S. Oil
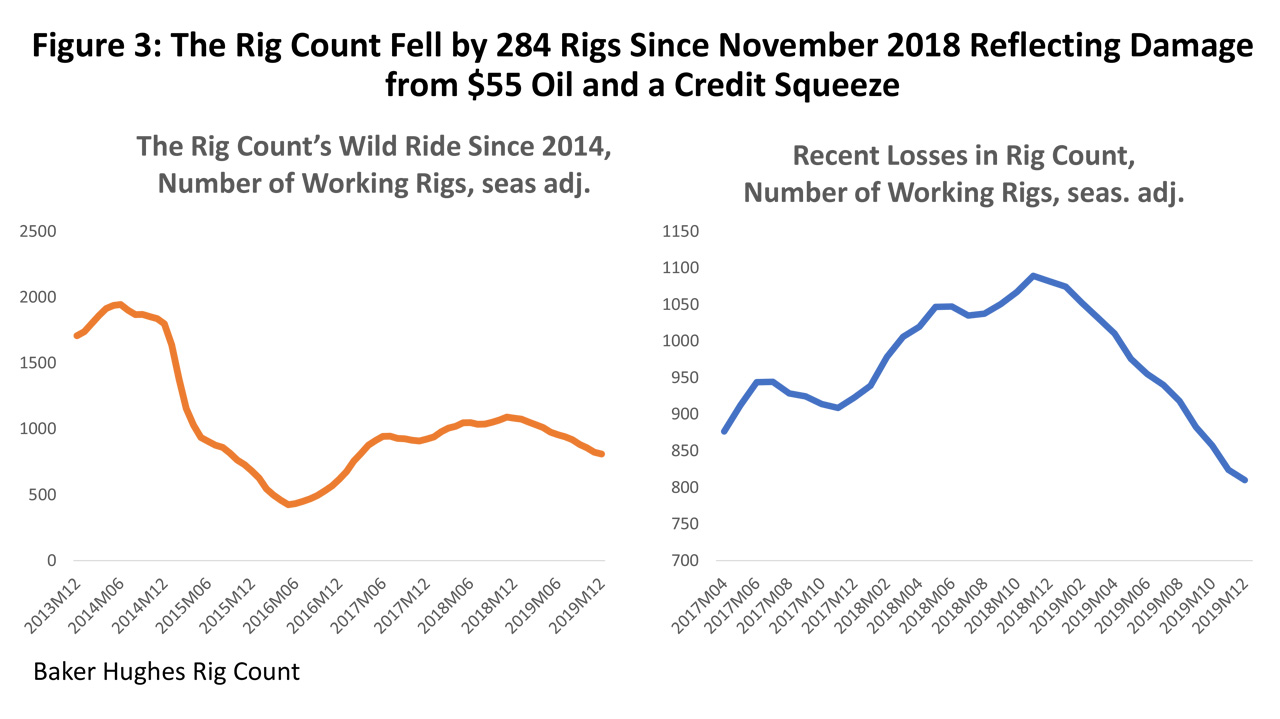
Our best and most timely measure of oilfield activity is the Baker Hughes rig count, a weekly reading of the number of active rigs. The left side of Figure 3 shows the performance of the rig count since 2014, with its peak near 2000 working rigs, then falling to historic lows near 400 rigs in 2016, and finally making a slow, seasonally adjusted return to 1089 rigs by November 2018.
The slow and incomplete recovery in the rig count was partly the result of new, larger, and more powerful rigs permanently displacing more than one of the existing, smaller, and older rigs. But the bigger difference in the level of the rig count between 2014 and 2018 was oil priced at $95 per barrel versus $65. The right side of Figure 3 is a closer look at current events and the impact of the credit squeeze, as the rig count ended 2019 with a December seasonally adjusted reading of 810 rigs, a fall of 279 since November 2018 or a decline of 25.6 percent.
Oil prices fell in 2019 to averaged $57 per barrel and the credit crunch began in earnest at mid-year. The Dallas Fed’s September survey of 142 energy executives asked about the main two constraints that were limiting oilfield activity in the near term. Low energy prices and limited credit were on the list to choose from, along with pipeline or other infrastructure barriers, lack of labor, and cost inflation.
The most important factor selected by 42 percent of executives was low energy prices and number two was credit-related issues. If we combine two choices -- limited credit and investor pressure to generate cash flow -- these factors accounted for 33 percent of responses selected as the primary limit on current activity. After energy prices and credit, none of the other possible factors made the list in a meaningful way.
Does a fall from $65 to $57 per barrel really make that much difference? If an oil producer is not hedged, then per barrel revenues fell 12.7 percent last year; based on the fall in natural gas prices, producers saw a similar fall of 18.4 percent per thousand cubic feet. However, there is also a loss of production to be considered when dealing with a high-cost source of oil like fracking. Suppose a hypothetical 20 percent of a producer’s oil production was no longer economic at these low prices or it could not be replaced at current prices, then the revenue loss is a much more substantial 18.4% + 20.0% = 32.7% for the oil producer and a similar 38.4% as natural gas producer.
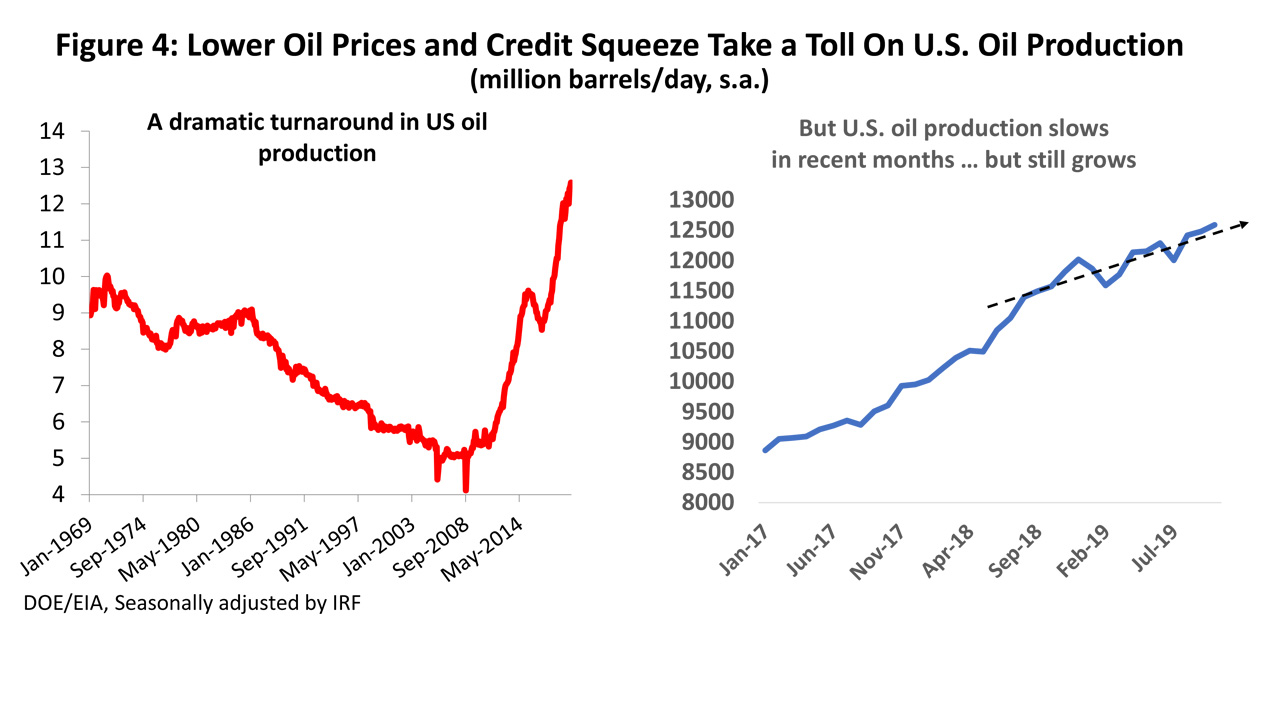
Last year saw U.S. oil production continue to grow, but at a slower rate. Two important weather events (a polar vortex and a hurricane) disrupted production in 2019, but now having worked through weather problems, daily U.S. oil production rose 4.7 percent in the first 10 months of 2019. This is far slow that 18.9 percent increase in 2018. See Figure 4.
Oil-related employment in Houston behaves differently from producing areas such as the Permian Basin. Very little oil production remains in the Houston area today. In contrast to the drilling activity seen in producing regions, Houston’s oil-based activity is a global headquarters and engineering center built on executive and technical talent. Houston oil employment moves much more slowly than elsewhere in response to oil prices because its work is more likely to be based on multi-year projects and involve high-order skills that companies will protect over the long term.
Our statistical model says that changes in the rig count bring slow but persistent changes in Houston’s local oil employment that play out over a couple of years. We did see a hard and fast fall of 74,888 jobs in Houston’s oil jobs in 2015-16, but it was the result of extraordinary changes: a fall in oil prices by over $50 per barrel, a fall in the rig count of 77 percent, and consecutive declines in the rig count for eight quarters. Even with a credit crunch underway, the current reversal is running on a much more moderate scale.
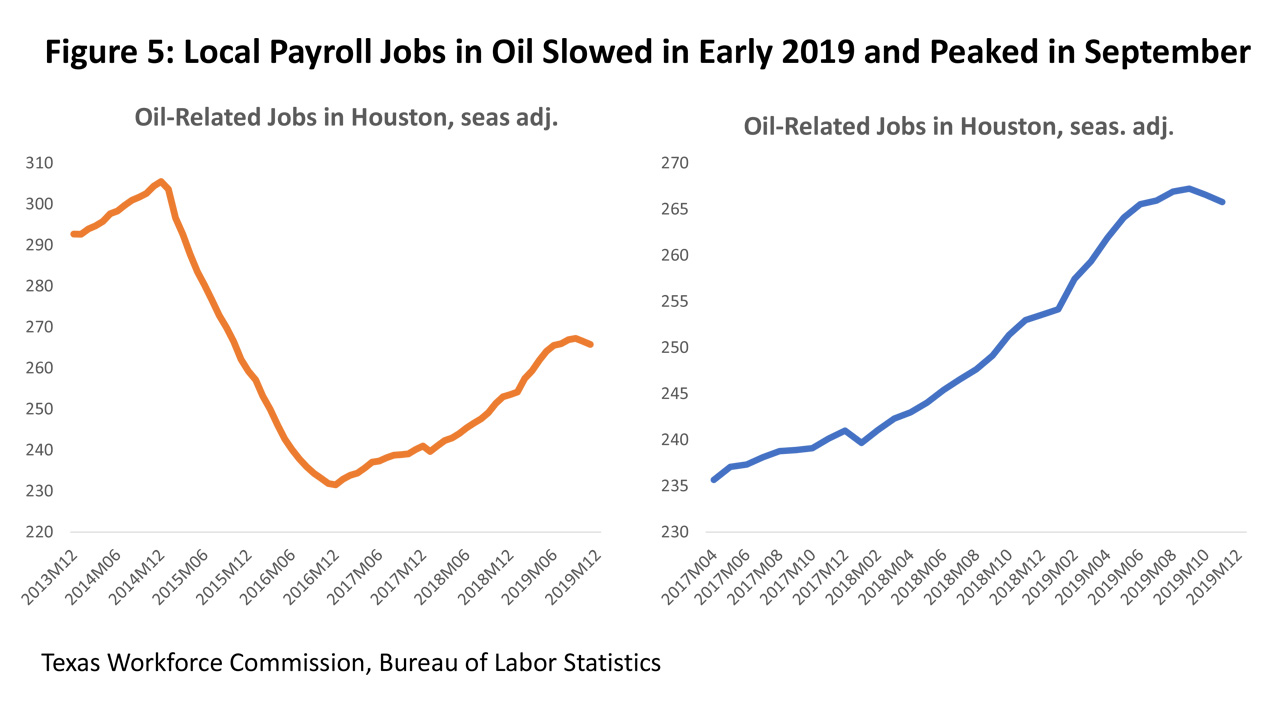
Figure 5 shows current estimates of the number of oil-related jobs in Houston. Jobs built on energy are broadly defined to include both upstream and downstream employment, but almost all the volatility in local energy jobs is driven by upstream producers, oil services, fabricated metals, machinery and selected sectors within wholesale trade and professional services.
The data in Figure 5 from the Texas Workforce Commission indicate that local oil-related employment grew by 11,700 in 2019 or 4.6 percent. However, oil jobs slowed at mid-year and peaked in September before declining by 1,400 jobs. Preliminary revisions to the data carried out by the Dallas Fed, as well as evidence from our statistical model, suggest a sharper slowdown that began earlier. The model, for example, suggests growth in oil jobs slowed to near zero by the second quarter of the year, remained stable, and then lost 1,700 jobs in the fourth quarter. All sources, however, point to oil-related job losses as currently underway in Houston.
Where Does the Credit Crunch Go from Here?
As we have seen, the combination of low energy prices and a credit squeeze have pulled the rig count down sharply, slowed domestic oil production, and begun layoffs and other employment reductions in Houston. Lower and higher energy prices could work to quickly worsen or improve credit conditions, but for now it appears that $55-$60 oil and $2.50 natural gas will be with us for a while.
Against this backdrop, the most recent Dallas Fed Energy Survey provides perspective on where we stand right now. The survey divides the oil industry into both producers and service and support industries, and the distinction is important.
- Producers are the decision makers who develop and hold the reserve base, decide what to drill for, and where and when to drill. They finance the projects and assume all the risks and rewards of the outcome. Producer capital spending refers to the spending required to replace or add new reserves and grow the reserve base. It is producer capital spending that will lead any turn upward in drilling in the current cycle.
- Service and support industries are suppliers to producers, providing equipment and expertise needed to carry out projects planned and financed by the producer. Service capital spending refers to new equipment needed to carry out projects, and in the current slack market for drilling there is already substantial idle equipment available. Even when the rig count turns up, it will be some time before new equipment is in great demand. Service capital spending comes late in the drilling cycle.
The following three figures show the latest Dallas Fed survey results from 170 energy firms, made up of 111 producers and 59 service and support executives. Figure 6 shows current and historical data regarding the level of current oilfield activity. The index value indicates expansion if greater than zero, contraction if less than zero.
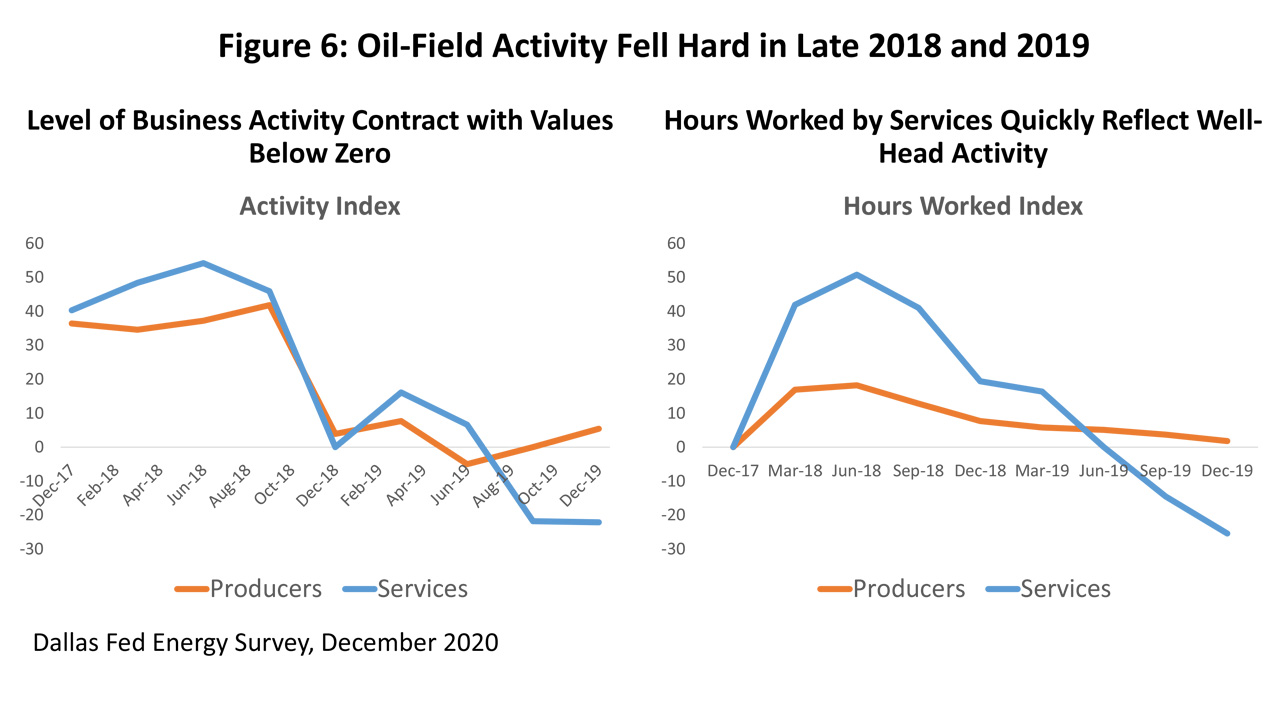
There was a sudden and severe change of energy regime in late 2018, as this measure of current activity plummeted from robust expansion to no growth. Through most of 2019 producer activity was stuck near neutral, while the service industry readings have turned negative.
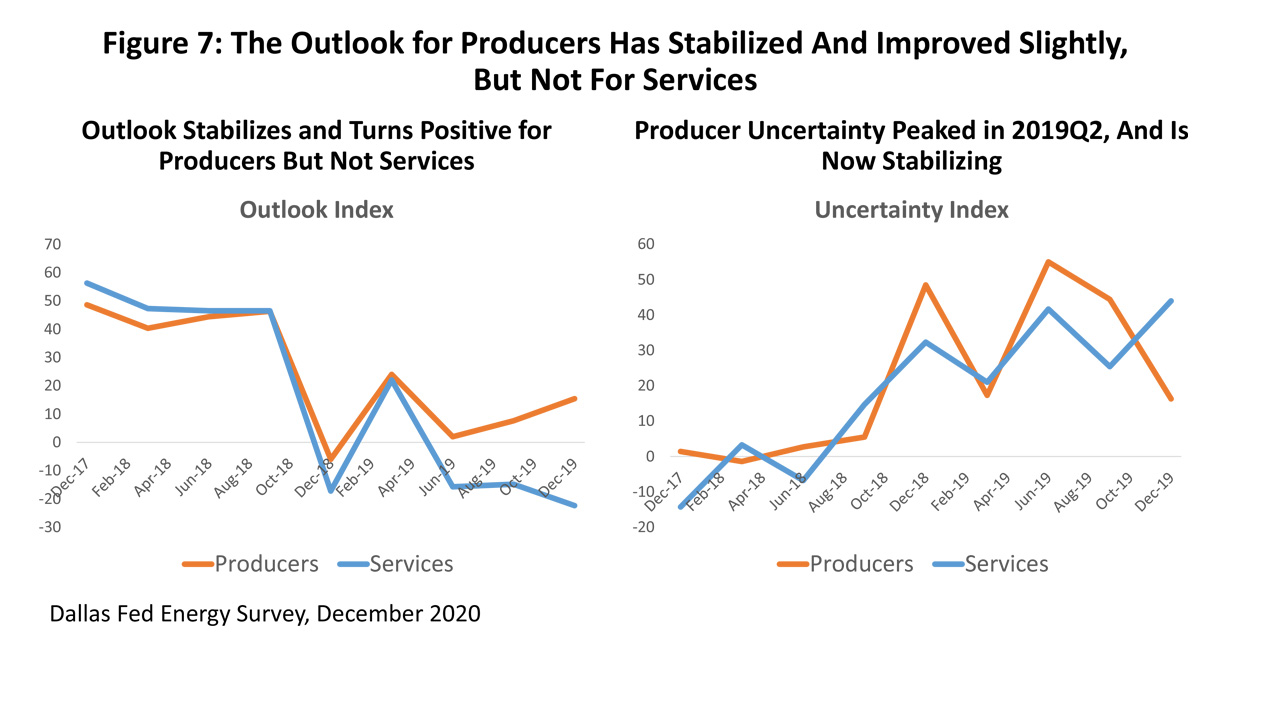
Expectations of future activity are shown in Figure 7 with the latest expectations compared to surveys dating back to 2017. The industry was apparently blindsided by the 2018Q3 peak in activity, having completely failed to anticipate it. The most recent outlook measures are just above neutral with modest improvement for producers and below neutral for services with modest continued deterioration. The right side of Figure 7 is a measure of how uncertain energy executives are about the future. Producers are now substantially more certain about where they stand in recent quarters, while service operators see uncertainty continuing to rise.
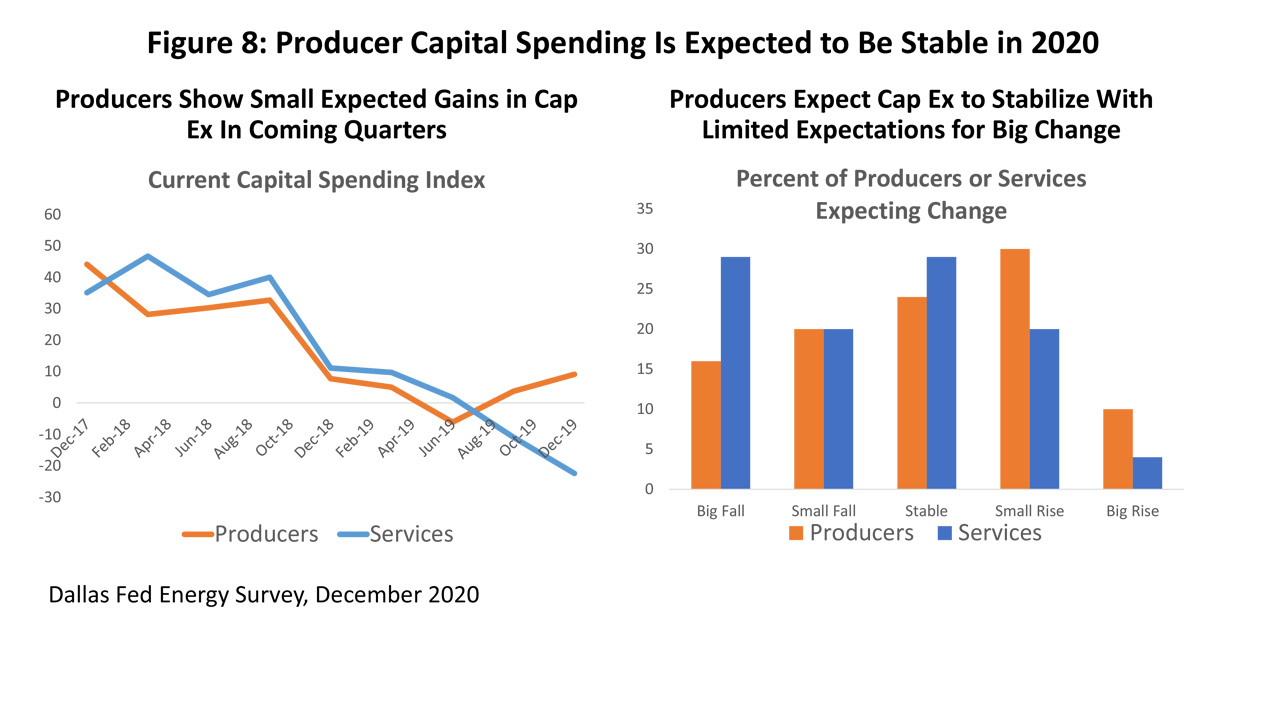
Producer capital spending is the key to future oilfield activity. In Figure 8, the chart on the left asks about levels of current capital spending by the oil industry, and producer spending has slowly picked up to move from neutral to low levels of spending. The right side of Figure 8 is expected 2020 annual capital spending by the oil industry, with producer spending skewed to the right in favor of stability and perhaps modest capital spending gains. The service and support industries show just the opposite. They have substantial excess equipment on their hands as long as the rig count is depressed, and they are cutting capital spending. They plan to weight their annual 2020 cap ex toward continued reductions.
What Now for Oil? And What about Houston?
Divining some specific path for the oil industry from here forward as it copes with lower oil and gas prices and bankruptcy is more than we could hope for. But we can put together some scenarios about future oilfield activity, ask how they might behave in good and bad times, and the implications for energy and payroll employment in Houston.
The conclusions we will draw from these scenarios are that current credit issues may be less serious for the local economy than some ominous current headlines might lead us to believe. While things have been serious indeed for the oil industry with a quick 25 percent fall in the rig count, we do see signs that there might be more stability ahead. The leading producer sector sees current activity as slightly positive, has expectations for capital spending that point to small improvements ahead, and producer uncertainty is substantially lower. The loss of local oil jobs so far appears to be real but moderate.
One thing we can know is what the best possible future scenario would be and how it would affect Houston. This Best Scenario is quite simple: The credit crunch has done its damage but is ending now. Oil prices return as the primary factor shaping activity ahead. There are no serious long-term credit consequences for the industry, and by 2024Q4 the same level of drilling activity prevails as we would have forecast before the credit crunch began.
This scenario is not meant to be realistic but simply serves as a stake in the ground. Alternatively, suppose we have a Worse Scenario that is a substantial and continued setback. In this scenario, we assume 75 more rigs are lost in 2020Q1, in addition to any losses already expected, and then repeat this in 2020Q2 with another 75-rig reduction. If this were to occur, the 2020Q2 rig count would be down by over 40 percent from its 2018 peak. Further assume that the loss of easy credit permanently shrinks the industry, and the rig count in 2024Q4 will return to levels of 50 rigs (or about five percent) lower than we would have forecast before credit became a major issue.
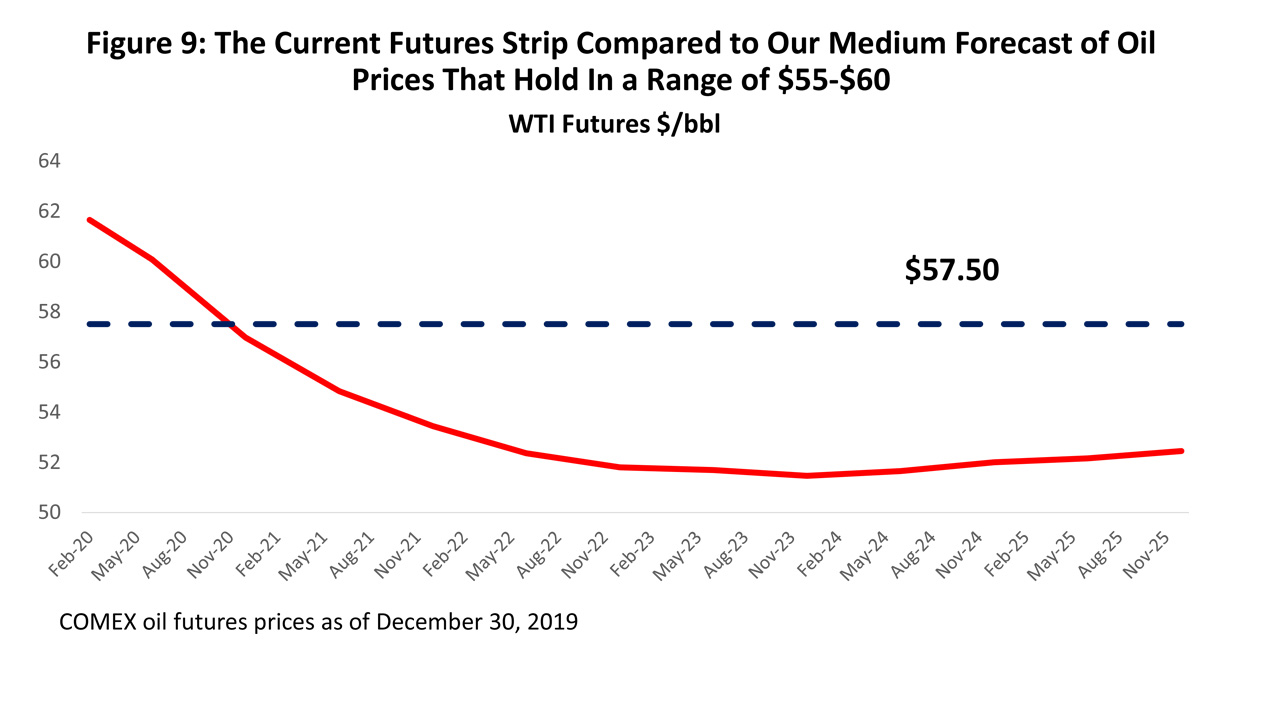
Our central estimate of oil prices going forward in our medium forecast is $55-$60. The executives in the Dallas Fed Energy Survey put the average 2020 oil price at $58.54. However, the futures strip for WTI oil prices has oil prices fall substantially below $57.50 by the end of 2020 and remain there through 2025. (Figure 9) However, as we have discussed in past reports, we think $55-$60 is a comfortable range for the Saudis and OPEC. It is high enough for them to survive internal budgeting pressures, and low enough to put pressure on American fracking and to slow U.S. oil production.
Higher or lower oil prices fit into the scenarios because higher oil prices alleviate credit problems and lower prices make matters worse. If the medium forecast is set at $55-$60 (at $57.50 for modeling purposes), our low forecast is for a sustained $40 oil price and the high is for $85 oil. These high and low prices will tend to dominate high and low scenarios as credit conditions move quickly to the back seat.
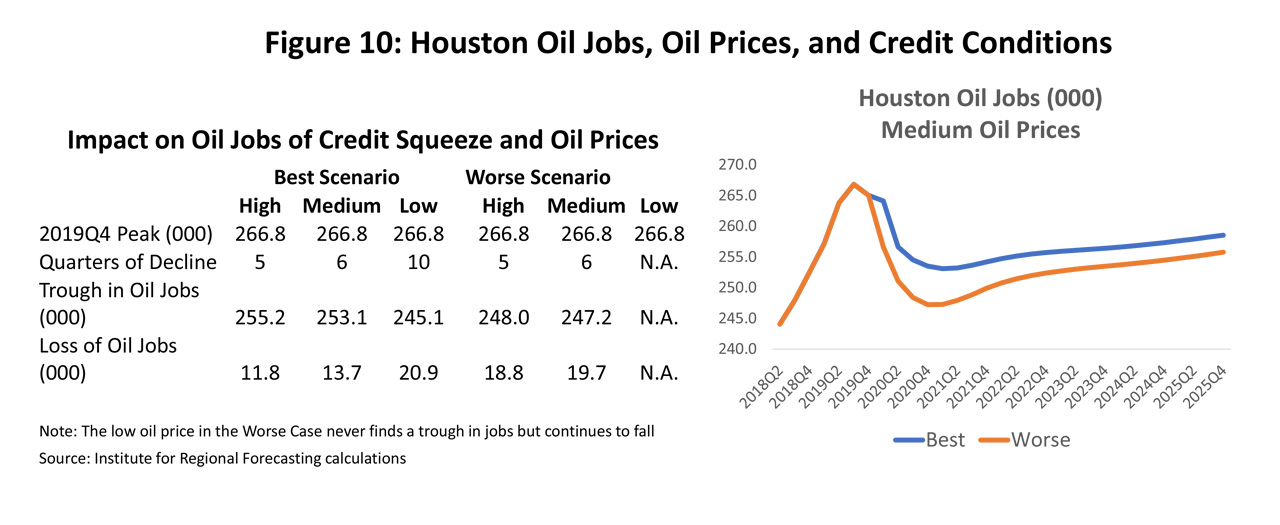
Figure 10 shows how Houston’s oil-related jobs react to the credit crunch at various oil prices. Oil employment in Houston peaked in 2019Q3, and then in the Best Scenario with high, medium, and low oil prices it takes 5, 6, or 10 quarters before a trough in oil jobs is found. Job losses range from 11,800 jobs to 20,900 jobs before turning back up again. In the Worse Scenario, the length of the downturn is the same as the Best except for low oil prices, and in low $40 case the number of oil jobs continues to slowly decline through 2025. Oil-related job losses in the high and medium scenario are 18,800 and 19,700.
Job losses in Figure 10 stand in contrast to the over 74,800 jobs lost to low oil prices in 2015-16. A strong national economy at that time kept even these severe oil-related job losses from pushing Houston into recession. Given the U.S. economy remains strong today, there is little reason to think that the credit crunch – with $55-$60 oil and the Worst Case foreseeing “only” 19,700 lost jobs -- will trigger a setback to the local economy. Credit conditions point to slower growth ahead, and our question simply becomes how serious a slowdown we might see.
The chart on the right side of Figure 10 summarizes the impact of credit conditions and oil prices on local oil jobs in these heavily managed scenarios. The Worse Case does significantly more short-run damage, of course, and there are long-run consequences to growth in the form of a smaller oil industry.
Global Outlook Turns Weak and Uncertain
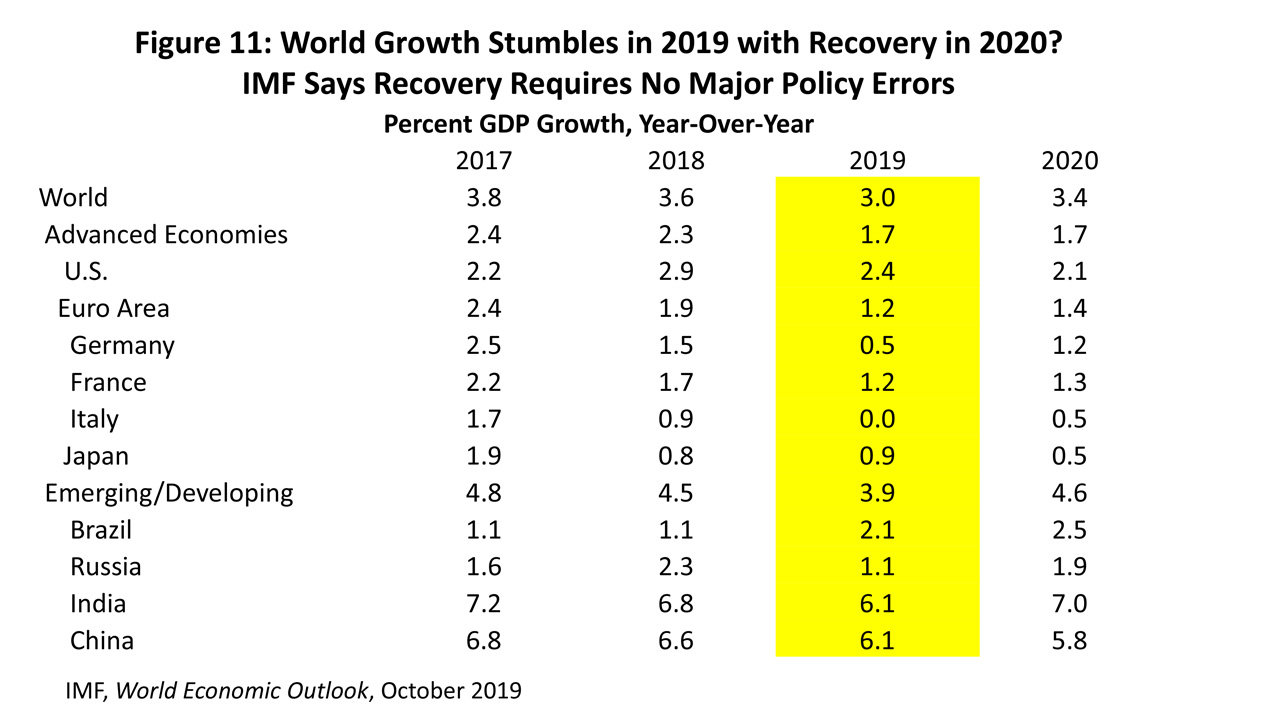
The latest World Economic Outlook from the International Monetary Fund (IMF) was released in October and was little changed from their July report. In 2017 and 2018 the global economy was running at rates of GDP growth at or just above long-run trends, but 2019 was forecast to see a sharp slowdown in growth to near 3.0 percent. See Figure 11.
Who slowed in 2019? Among the advanced economies, the U.S. remained the star performer and Japan held on to previous slow growth. Europe turned into the laggard in 2019 with major countries like Germany and Italy seeing growth rates slow or reverse.
Emerging and developing economies were a mixed bag in 2019, but collective GDP growth slowed by half a percentage point, led by Russia and China. Sanctions on Russia for its incursion into Crimea still weigh on its economy, and China was hurt by U.S. tariffs.
The current forecast for 2020 is recovery to 3.4 percent GDP growth, but the report came with a series of ominous warnings about a high level of risk associated with this improvement: the world is at a delicate juncture, the expected pick-up in growth in 2020 is precarious, and the risks are mainly to the downside. The IMF made a clear call to action by central banks in the developed world to cut interest rates, and for general progress on trade and tariff negotiations.
Central banks have responded to the IMF’s view of the global outlook with at least 30 banks cutting rates including the U.S., U.K., Europe, Australia, Mexico and India. Progress on trade and tariffs has also shown up late in 2019. The old NAFTA, what soon will become the new U.S. Mexico Canada Agreement or USMCA, has apparently fallen into place. Approval by the House of Representatives was the last significant hurdle, the U.S. Senate has now followed, and only Canada must still follow up. The new agreement makes many changes around the periphery to NAFTA and is an important modernization of rules to promote trade in services, protect intellectual property, enhance digital trade, and to fight corruption. The most important aspect of the accord, however, is that it again gives certainty that the world’s largest free trade zone will continue to function effectively and well for years to come.
The second important advance in trade in late 2019 was the Phase One Agreement between the U.S. and China on tariffs, finally signed in mid-January of this year. The accord foregoes planned December tariffs on $160 billion of Chinese consumer goods and rolled back by 50% another $120 billion round of tariffs implemented earlier in 2019. Combined with the Chinese retaliation that would be forestalled by these tariff cuts, this could reduce the losses to U.S. and Chinese GDP growth from the direct impact of tariffs by as much as 50 percent. Tariffs would continue at 2018 levels as currently levied on $360 billion of goods, including steel, aluminum, and washing machines. Any relief here waits for a Phase Two Agreement, presumably after November 2020.
The Phase One Agreement contains improvements in trade of financial services and limited progress on theft of intellectual property. Enforcement actions look strong on paper. China committed to buy $78 in U.S. manufactured products over 2017 levels, $32 billion in U.S. agricultural products, $38 billion in services, and $52 billion in energy products led by LNG, crude oil, oil products, and coal.
The third big change in late 2019 was the final approval of a British exit from Europe on January 31, 2020. The ability of all parties to pull together a working trade agreement in that short time period is questionable, but efforts are underway. The agreement leaves significant internal rancor behind for the British from internal political opposition, as well as continued opposition from Scotland and Northern Ireland. The best news is that – like NAFTA – there is finally some certainty about the direction of future policy.
Putting tariffs aside, problems for China continue and are centered on a financial sector that has taken on debt levels that are three times GDP. This overleverage is a problem, but the debt levels also currently limit policy options to deal with slower Chinese growth. The Chinese slowdown is spreading through southwest Asia.
Europe is the other trouble spot, even after some resolution on BREXIT. Italy is the third largest economy in Europe, and it slipped into recession in 2018. Italy also holds the third-largest sovereign debt in the world behind the U.S. and China. Recession and an ongoing budget crisis put Italian debt at risk, along with those European banks that hold large amounts of that debt. Meanwhile, Germany is Europe’s largest economy, and a slowdown in auto manufacturing has slowly turned into a manufacturing recession and a near-2019 recession for the German economy. The Bundesbank forecasts only 0.5 percent GDP growth for the country in 2020.
The IMF forecast a rebound in global growth in 2020 conditioned on less restrictive monetary policy, progress on trade and tariffs, and a resolution of BREXIT. They should be pleased with the progress made on these policy issues, and likely will forecast improved global growth in 2020. But continued tariffs, China, and Europe remain as potential problems that will keep risk high and weighted to the downside, no matter the extent of improvement.
U.S. Economy Slower, but Still Steady
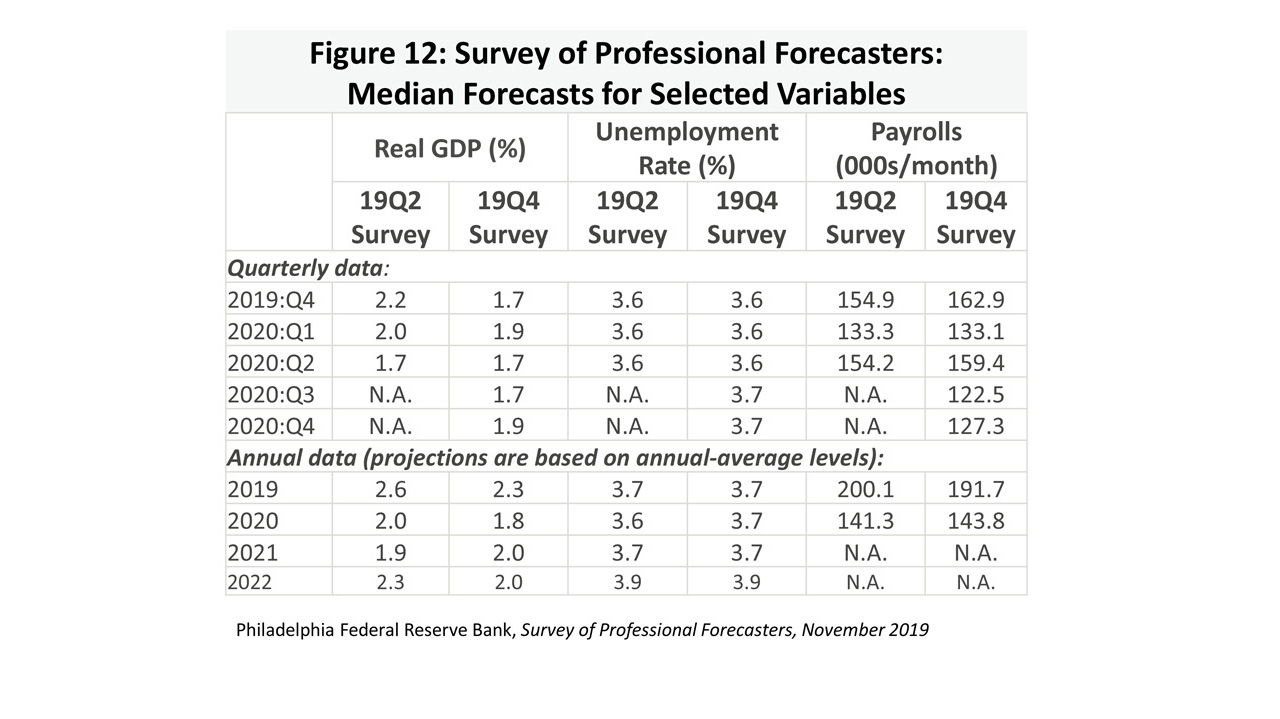
The U.S. economy slowed in 2019, but on a schedule that was largely anticipated by past forecasts. Figure 12 compares the U.S. economic outlook from last May to where we stand in the latest November forecast from the Survey of Professional Forecasters. The current GDP figures are slightly weaker than May, and the unemployment rate and payroll employment figures are essentially unchanged. Recent changes in the outlook for Houston’s economy are driven mostly by oil and not by changes in the U.S. outlook.
The current U.S. economic expansion is now the longest in American economic history, spanning 126 months and parts of three decades since June 2008. Its length seems to have bred a preoccupation in the press and elsewhere with pending recession, as if its advanced age predicted approaching death. Economic expansions don’t die of old age, however, but generally must be killed off by speculative excesses such as a financial crisis, a tech bust, or an oil price spike. The only recent candidate on the horizon for such excesses is the trade war, and this seemed to have moved to the back burner for the moment. Continued positive economic news has put thoughts of near-term recession even further into the rearview mirror.
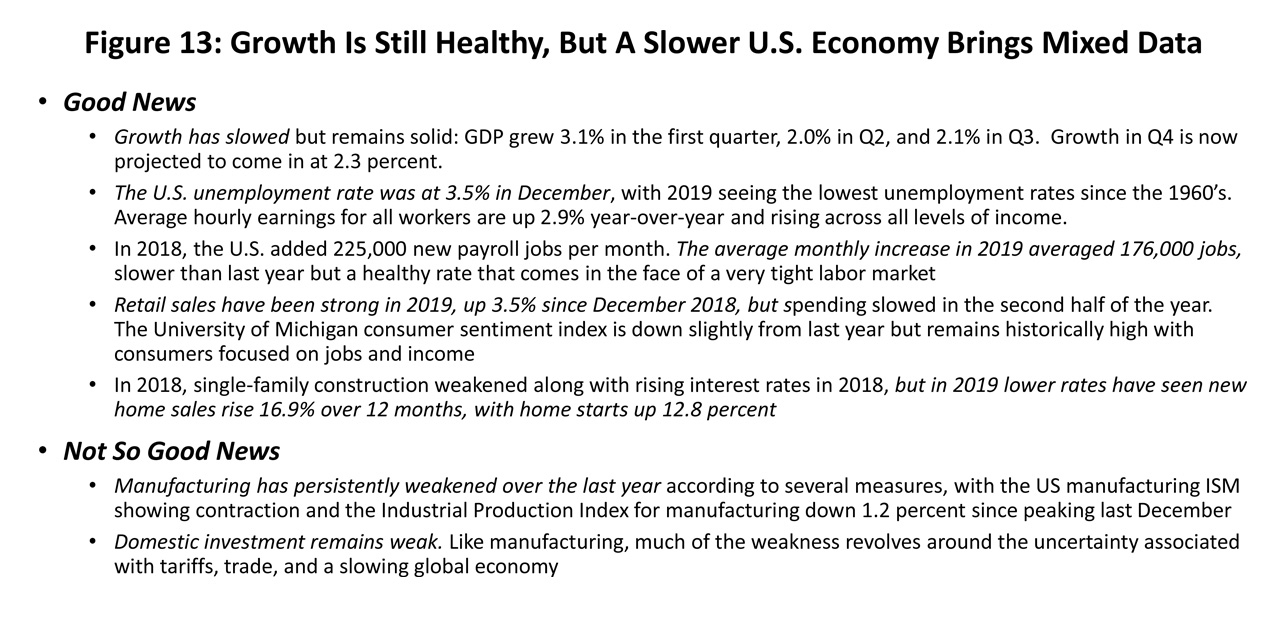
Figure 13 provides a brief summary of recent economic news that remains mostly positive and reflects slower but steady growth. We see moderate GDP growth, the lowest unemployment rates of the last 60 years, a strong job market with rising wages, and a housing market revived by lower mortgage rates. The bad news is a moderate contraction of manufacturing and weak investment, with both these factors having their roots mostly in the tariffs and trade disputes.
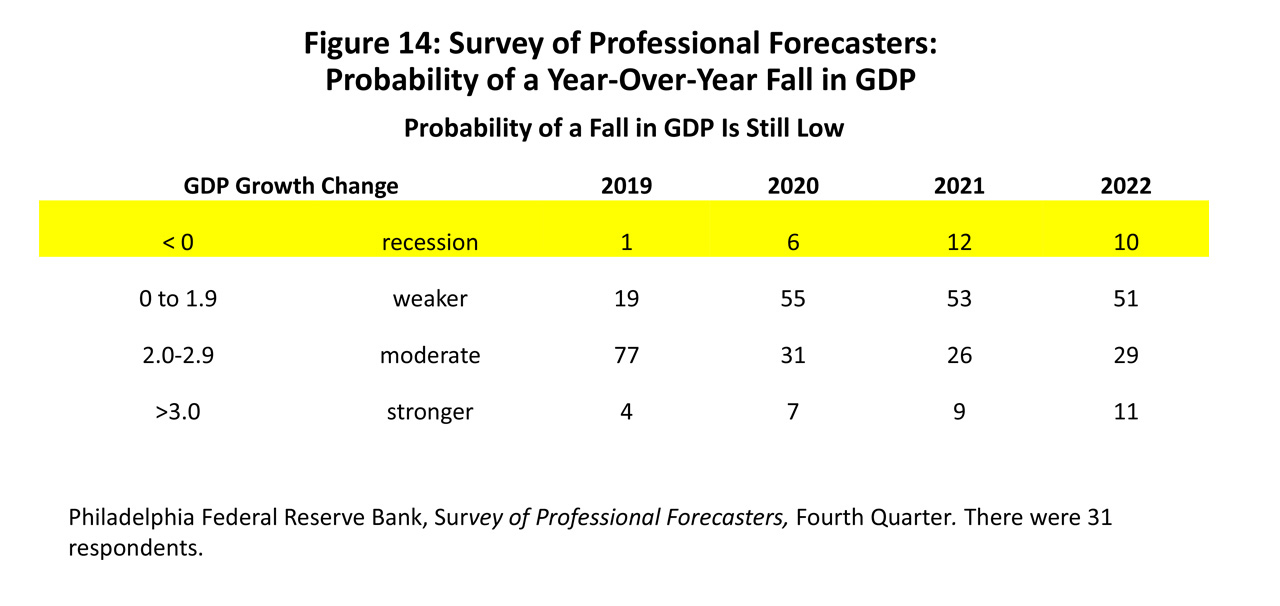
The gloomiest reports on recession probabilities continue to come from surveys of panels of economists. The membership of the National Association of Business Economists puts the probability of recession at 43 percent before the end of 2020, while the Wall Street Journal panel has recently reduced its probability of 2020 recession to 23.5 percent. These surveys are based on ill-defined respondent opinion, and the Survey of Professional Forecasters offers a better way to ask the question: What is the probability of a year-over-year decline in GDP? It is not exactly the definition of a recession, but is an improvement over just asking someone to check a box concerning about what they think that day. Using this definition, the forecasters have a six percent chance of recession in 2020, 12 percent in 2021, and ten percent in 2022. See Figure 14.
As measures of the probability of recession recede, we see continued expansion ahead as the best planning scenario for moving forward. There will certainly be another recession to come, but the problem is knowing what will trigger it and when. The business cycle can move from almost certain expansion to contraction in only a few months, but the problem is foreseeing such a move. Typically, it is 4-6 months after a recession begins that economists even know it is underway, much less predict its arrival. For now, the recession scenario is best left for contingency planning and for knowing how you will deal with an unexpected rainy day when it arrives.
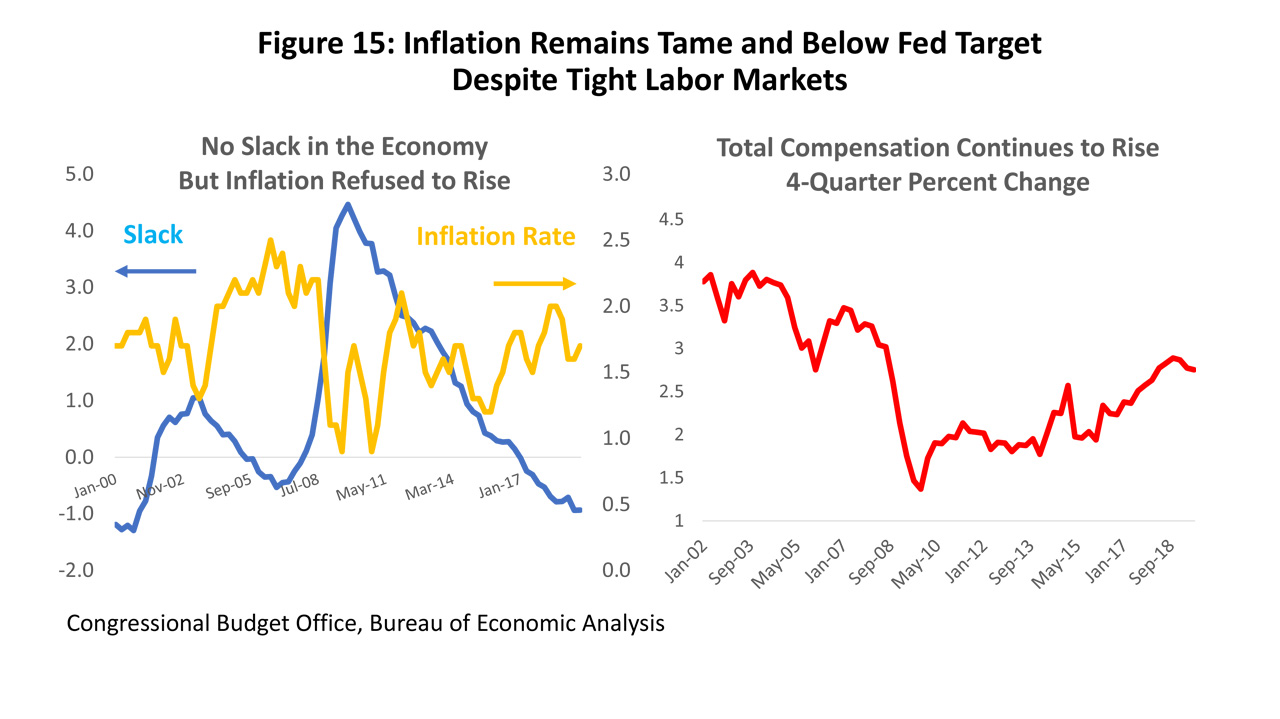
Federal Reserve policy decisions center on the two charts shown in Figure 15. The chart on the right shows the measure of slack in the economy employed by the Congressional Budget Office, and it says the economy now has moved more than a full percentage point below full employment. The chart on the right shows that a very tight labor market has responded with only moderate increases in wages, salaries and benefits that have risen only 2.8 percent over the previous 12 months. Most important, the Fed’s preferred measure of inflation (the personal income deflator less food and energy) has remained well below its target rate of two percent.
After aggressively raising rates in 2018, the central bank reversed course in July 2019 with three rate cuts. The rate cuts reflected concern about the effect of tariffs on the U.S. and global economy, a slowing U.S. economy, and a weaker global outlook. With no apparent pressure from inflation, it became an easy decision to reverse course and take out an insurance policy on continued economic expansion.
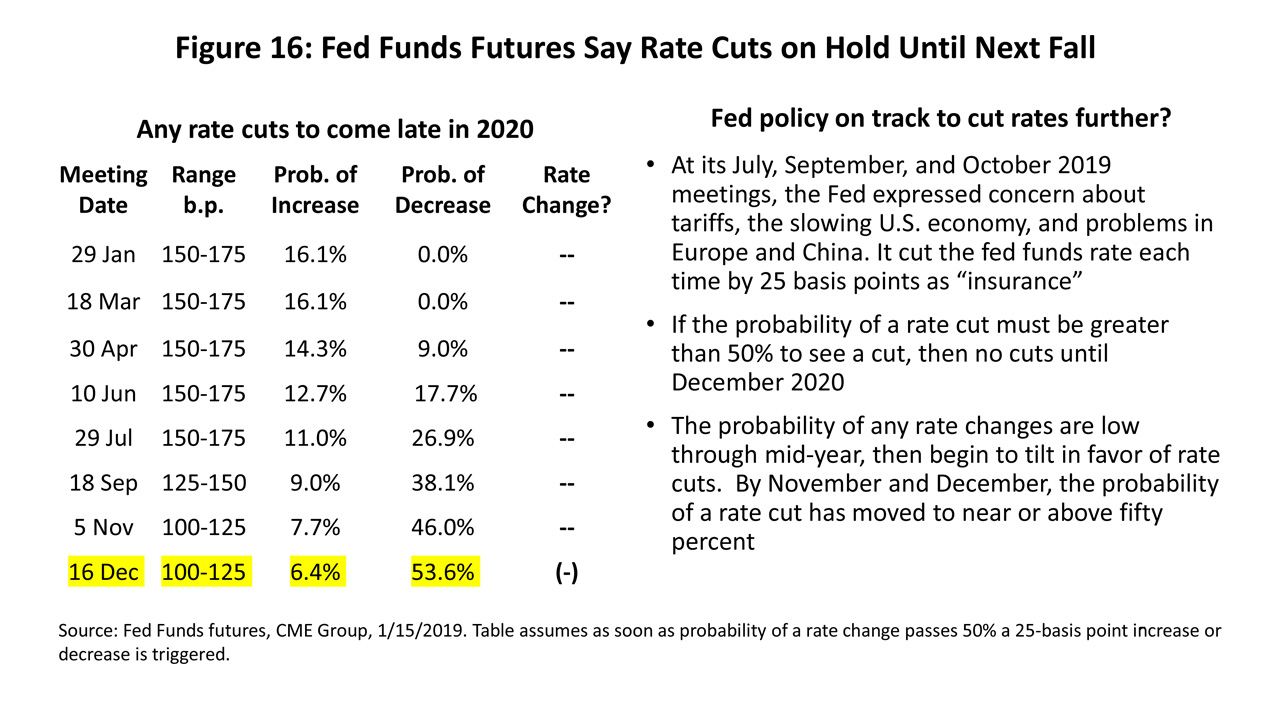
Since the last rate cut in October the Fed has clearly indicated that rate changes are on hold for the foreseeable future. The Federal Funds futures market sees little chance of a cut in interest rates before September 2019, and it is December before the probability passes 50 percent. Federal Reserve policy typically goes on hold as election season heats up, and the market reflects those expectations. See Figure 16.
Houston’s Current Economy Hurt by Oil Again, Propped Up by U.S. Growth
After the Great Recession ended in 2009 and through the end of 2014, Houston’s payroll employment grew at a 3.1 percent rate and the U.S. at 1.3 percent. (Figure 17) It was a growth advantage quickly lost by Houston in 2015-16 with the collapse of oil prices and two years of no growth.
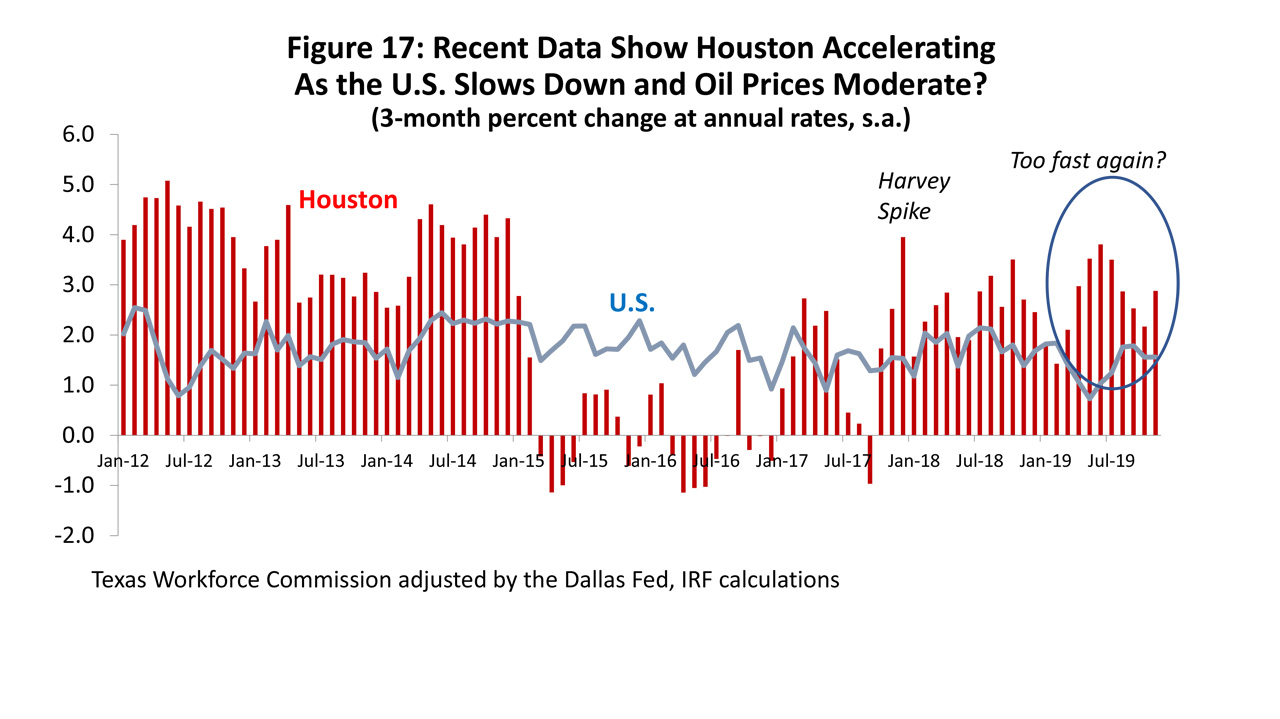
The burst of job growth at the end of 2016 and carrying into early 2017 was the result of higher oil prices as OPEC returned as swing producer in world markets, but OPEC proved unable to maintain that momentum past the spring of 2017. Additional jobs came only with a late 2017 one-time spike due to Hurricane Harvey.
In 2018, OPEC was able to reinvigorate oil markets for much of 2018 with the help of Russia and other large non-OPEC oil producers that helped prop up oil prices. Local job growth responded, but by the end of 2018 oil prices had fallen back to near $50 and in 2019 averaged only $57 per barrel. These prices proved low enough to bring on the credit crunch we see today.
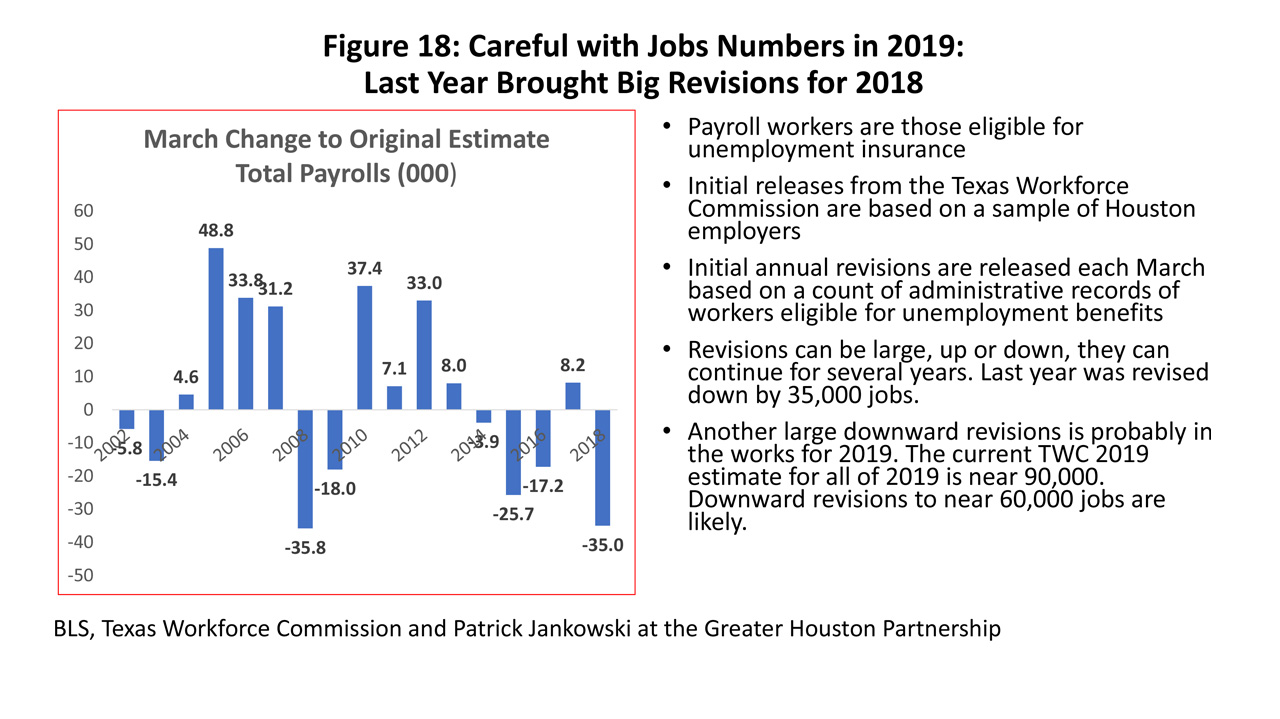
The 2019 reference in Figure 17 to growth being “too fast again” is because: (1) Houston’s estimated payroll employment growth ran far too high throughout 2018 before being revised down by 35,000 jobs, and (2) estimated growth in 2019 again seems to be running much faster than economic fundamentals can support. The current estimate of payroll employment for 2019 is on track to add about 90,000 jobs, a figure far above trend growth of 64,000 jobs. Given moderate growth in the U.S. economy, an oil industry that is back on its heels once more, and what we can see from other data sources, the 2019 estimate also seems to be well out of bounds.
Figure 18 summarizes the problem. The TWC/BLS’s estimates of payroll employment are made timely by relying on a sample of data that is reported the following month. The sample data remains unrevised month after month until the following March, and then the sample is made current by drawing on accumulated administrative records of the number of workers eligible for unemployment insurance. As Figure 18 shows, once the sample is discarded and the new records are used the annual March revisions can be very big. If current trend growth in Houston is around 64,000, note that revisions have exceeded 30,000 in seven of the last 16 years. It seems likely that 2019 will make it eight of the last 17 years.
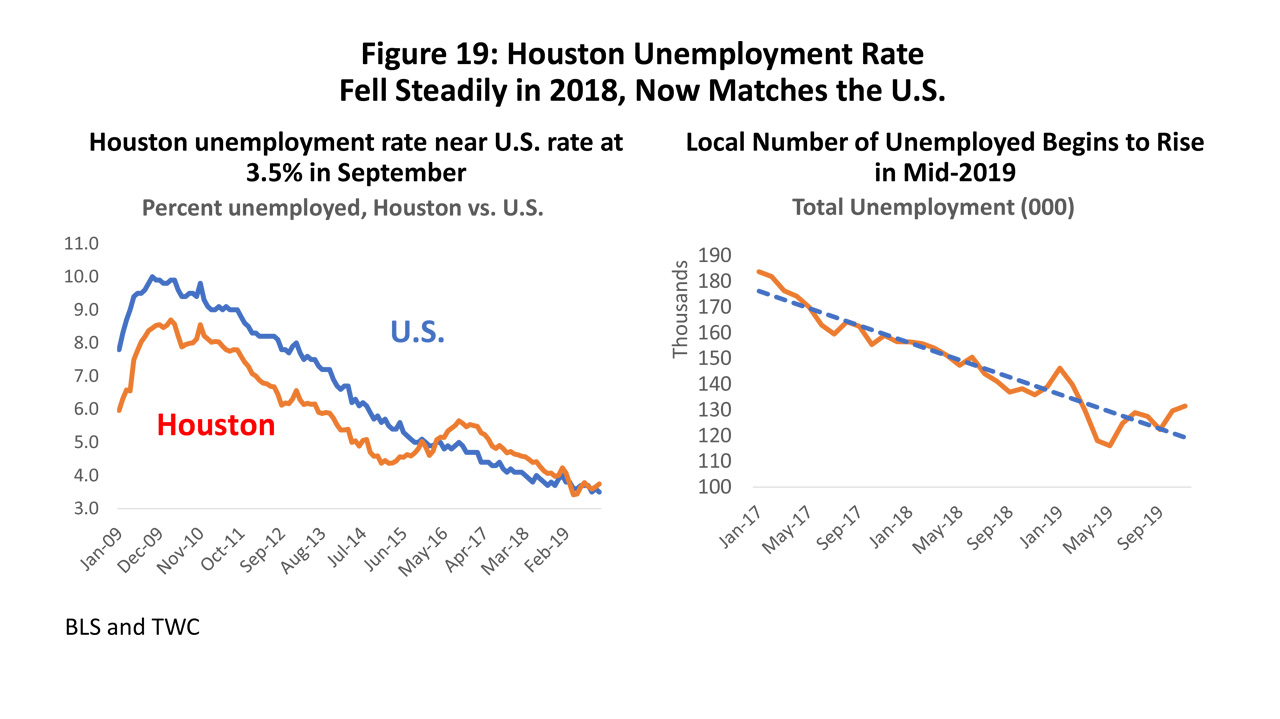
Houston’s unemployment rate does not tell the story of recent growth in the same detail as the payrolls, but Figure 19 shows the strength of the local economy relative to the U.S. reflected in its low unemployment rates before 2014. Then the tables turn strongly in favor of the U.S. economy in 2015-16, only to see the U.S. and Houston slowly return to parity with both now at historically low rates of unemployment. The only sign of weakness in this current data is in the right side of Figure 19, where we see a small increase in the number of people unemployed in Houston beginning in May 2019. The timing with the onset of the credit crunch and the fall in the rig count is probably not a coincidence.
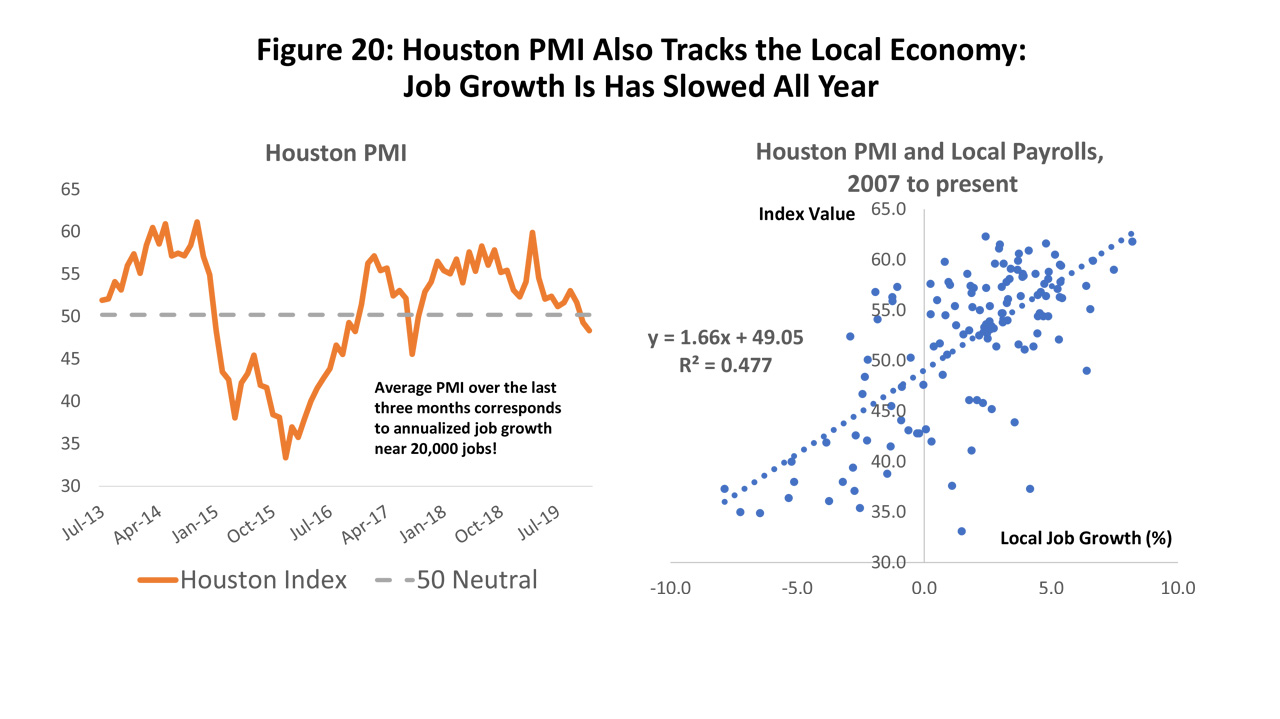
The Houston Purchasing Managers’ Index (PMI) is certainly not registering strong growth right now. If the index is greater than 49, local payroll employment is growing, and if less than 49 it shows contraction in employment. Unlike the robust payroll employment figures, the PMI indicates that the Houston economy has been steadily slowing since March.
The most recent November reading of the PMI is 49, right on the breakeven point for job growth, and the average of the last three PMI readings is consistent with an annual rate of jobs growth of about 20,000. The extent of the scatter in the relationship between this measure and employment in Figure 20 is warning enough that a single observation can’t be trusted too far, but the continued negative trend is a concern.
Changes to Houston’s Economic Outlook? Blame Oil’s Credit Squeeze
Several important factors drive Houston’s current outlook. (Figure 21) We start with oil prices that set up three scenarios: a medium price scenario at a continued $55-$60; a high price at $85 driven by significant and prolonged disruption to oil markets; and a low forecast at $40 per barrel, perhaps due to U.S. overproduction or if OPEC were to again punish American fracking for overproduction.
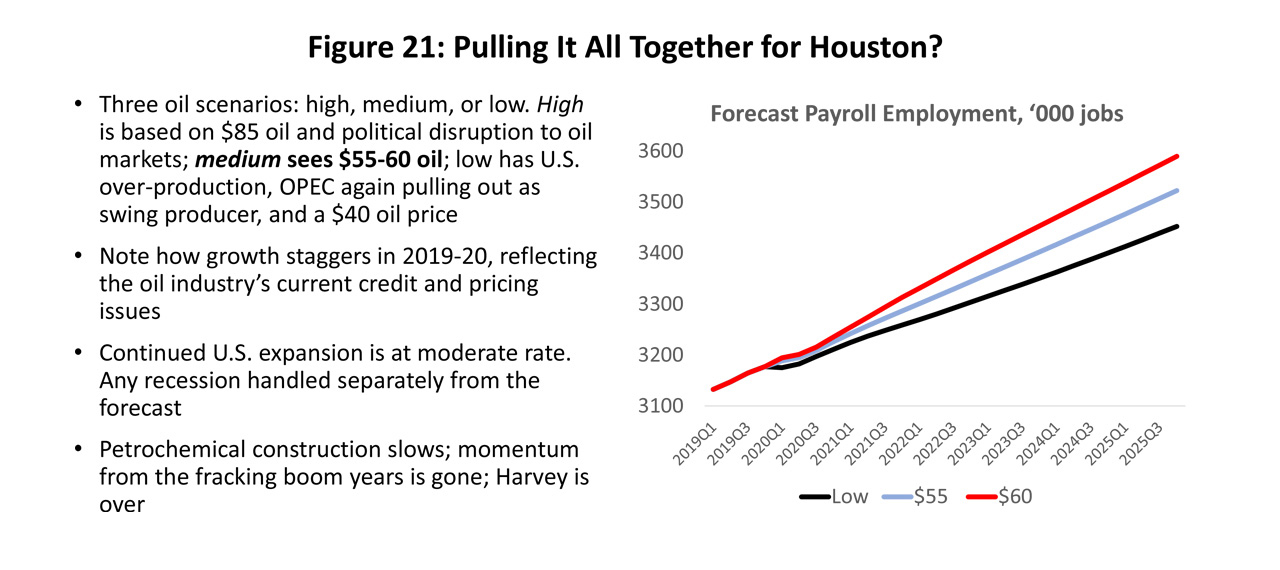
We assume U.S. growth continues the moderate growth path described by the Survey of Professional Forecasters in its 2019Q4 outlook. The growth stimulus from the recent petrochemical boom is behind us, any stimulus from the years of the fracking boom is long behind us, and there are no lingering effects of Hurricane Harvey that are big enough to affect the business cycle.
The chart on the right side of Figure 21 shows the 2019 and 2020 distortions to Houston payroll employment caused by the current oil-industry credit squeeze, and how the forecast then moves back along a smoother growth path. Remember we have two scenarios for credit, a Best Scenario with a quick cure for credit problems and few lasting consequences, and a Worse Scenario for credit that adds two quarters of further significant oilfield decline and assumes an industry that is about five percent smaller thorough 2024.
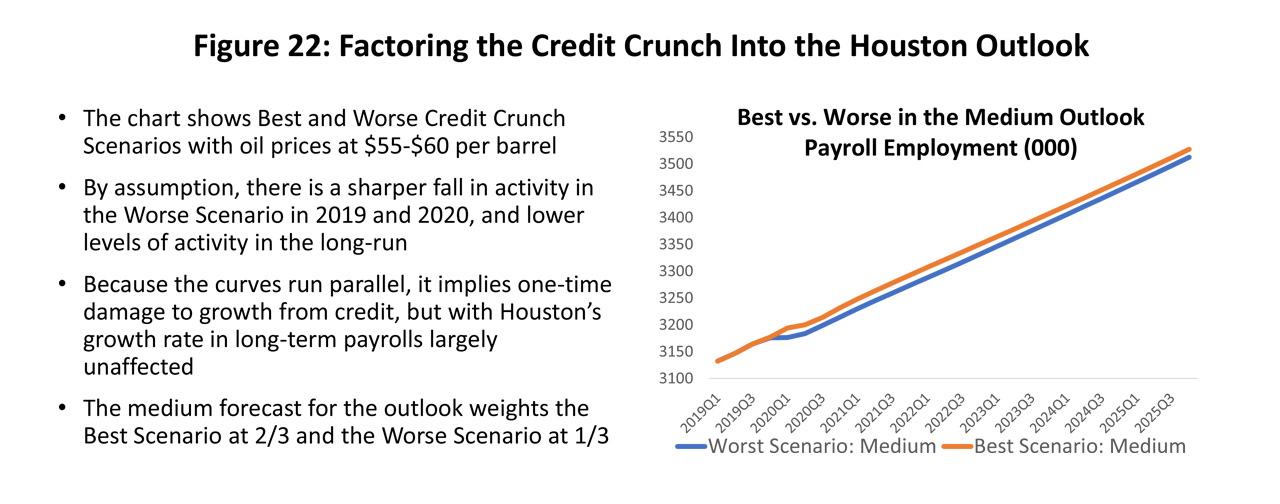
The Best Scenario has three outcomes depending on oil prices ($40, $55-$60, $85), and the same for the Worse outlook. Figure 22 compares the Houston payroll projections under medium oil prices for both credit scenarios. The curve tells us that the effect of the credit crisis on Houston is concentrated early in the forecast but also includes a one-time downward shift for the Worse outlook. The fact that the curves run parallel implies once the crisis phase passes Houston employment growth is largely unaffected, even if the industry is somewhat smaller. For the base case or medium Houston employment forecast we have used $55 to $60 oil prices and then weighted the Best/Worse scenarios at .667/.333, i.e., weighted more to the optimistic than pessimistic view. Both the scenarios were meant to stand in for extreme positions, and we think they do that well enough.
Certainly, the current headlines are ugly regarding bankruptcy, mergers, delistings, etc., but they also reflect a healing process that seems to be well underway. If we focus on the decision-making producer sector, the Dallas Fed Energy Survey points to two quarters of recent stability, even if at low levels of activity. The service and support industries, in contrast, hold substantial overcapacity, and while their employment level could stabilize, it is unlikely that pricing or capital spending can turn up soon.
Our high and low forecasts for Houston consider both price and credit conditions. The high forecast used for the Houston outlook combines the Best credit outlook and $85 oil, and the low forecast combines the Worse credit conditions and $40 oil. In both cases, the high or low oil prices quickly come to dominate any credit conditions.
Our forecast of Houston’s job growth is shown in Figure 23. The 2019 forecast is set at 59,100 jobs for 2019, based on expected March 2020 revisions from the TWC that will see the current payroll estimate reduced substantially. Growth in 2020 falls to 49,400 jobs, then picks back up to a steady 60,000 jobs as the credit crisis passes. Based on a long-term growth rate near 2.0 percent and 3.2 million workers in Houston, trend growth is 64,000 or higher. The forecast falls short of that mark but remains quite healthy if a little subpar.
The 49,400 jobs in the medium employment scenario assume a Best/Worst weighting of .667/.333. If we turn these weights around, with the heavier weight on the Worse Scenario, the 2019 number stays 59,100 but 2020 falls to 44,100. Either way, near-term damage from credit problems remains contained to 2020, with a loss of 10-15,000 payroll jobs compared to expectations from other recent forecasts.
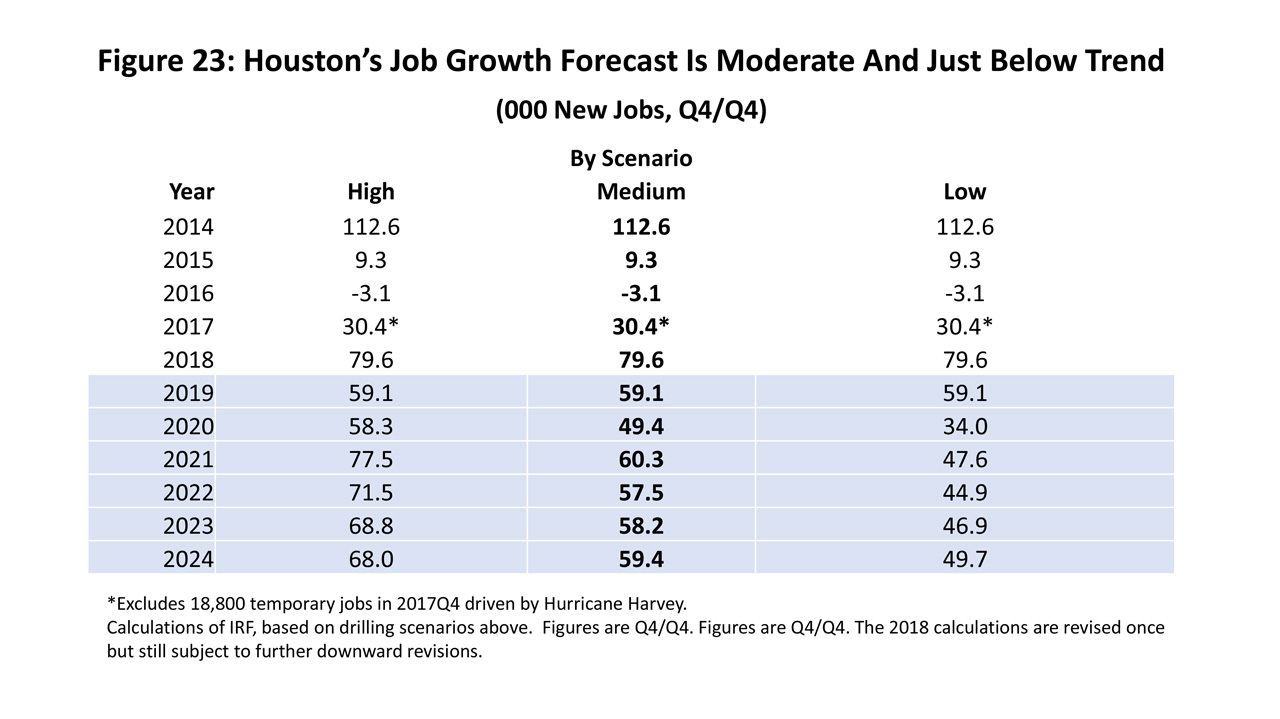
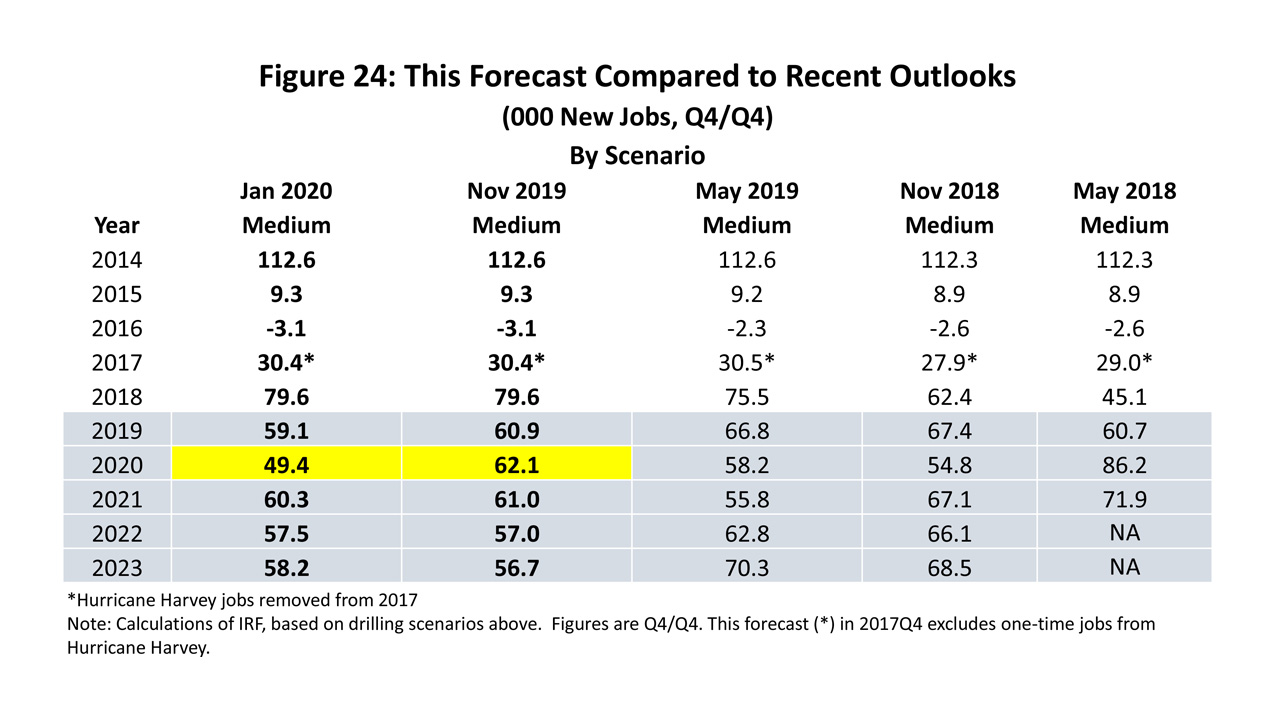
Figure 24 compares the current outlook to several forecasts from the recent past. As we said in the introduction to this report, our need to revise the forecast since last November speaks for itself in terms of the speed with which the credit crisis unfolded -- and to our ability to anticipate such events. The only significant change in this forecast is the impact of oil-industry credit conditions, but that is nothing new -- virtually all the large changes in Houston’s economic outlook over the last decade can be attributed in one way or another to oil markets.
Written by:
Robert W. Gilmer, Ph.D.
Institute for Regional Forecasting
January 17, 2020