Houston Updates
-
Archive
- June 2025
- March 2025
- December 10, 2024
- September 14, 2024
- May 21, 2024
- March 19, 2024
- December 9, 2023
- June 16, 2023
- April 6, 2023
- March 17, 2023
- Dec. 19, 2022
- Sept. 14, 2022
- July 4, 2022
- March 27, 2022
- March 9, 2022
- September 2021
- April 2021
- March 2021
- September 2020
- August 2020
- June 2020
- April 2020
- March 2020
- January 2020
- December 2018
- June 2018
- March 2018
- February 2018
- January 2018
- September 2017
- September 2017 Post-Hurricane
- June 2017
- March 2017
- January 2017
- September 2016
- March 2016
- December 2015
- September 2015
- June 2015
- March 2015
- December 2014
- June 2014
- March 2014
- November 2013
- September 2013
The Outlook for Houston's Economic Growth Is Still On Track Even as COVID Variants Linger
September 13, 2021
We are moving toward a finish line for the pandemic — or at least an economic standoff with the virus and its variants — that will probably be reached by mid-2022. We have known that a vaccine would be required to halt the spread of the virus, and it has so-far proven to be effective in controlling disease and reducing its adverse economic consequences.1 Meaningful social distancing and public health measures will remain in place through 2021 and probably well into 2022, but they should continue to recede as the as the availability and use of the vaccine spreads. It will take longer for Houston to sort out lingering problems from the broader downturn in the national and global business cycle — and especially the oil industry.
This report is an update on economic progress in Houston in the wake of the COVID outbreak, and a forecast of how growth could unfold over the new few years. The lockdown period in March and April of 2020 saw a shocking reversal of employment has been only partially offset by this July, even though the most stringent public health measures have been lifted. Real economic progress did not resume until vaccinations became widely available in February and March of this year. Most remaining mandatory public health regulations in Texas were quickly dropped at that time, such as mask mandates and limits on room occupancy, and the public began to shop, dine out, see a movie, or travel. Employment has returned rapidly along with renewed social activity.
However, Houston is a significant laggard in this recovery compared to other major Texas cities. (See Figure 1.) For example, in Houston we lost 367,000 jobs to the initial lockdown period and only 57.4 percent had returned by this July. Compared to other major metro areas across the state this is by far the weakest recovery, with Austin having returned all the lost jobs plus 3.1 percent more. Dallas has returned 98.9 percent, San Antonio 79.8, and Fort Worth 72.4. The state as a whole is well ahead of Houston’s schedule at 74.9 percent.
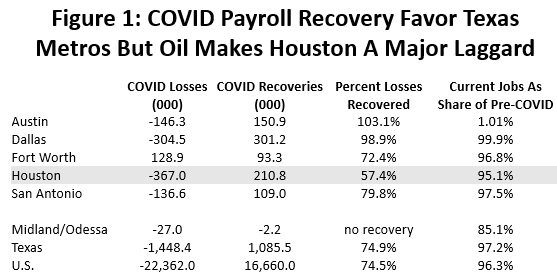
The obvious culprit in Houston is its heavy local mix of oil jobs, and Midland-Odessa provide the example that proves the rule. Figure 1 shows that these oil-field cities have seen no recovery in payroll jobs after the COVID lockdown period, and through July of this year their employment has fallen another 2.2 percent. Houston’s economic growth is driven approximately 60 percent by the U.S. business cycle, 30 percent by oil markets, and 10 percent by long-term factors such as demographics and the Texas Growth Formula. But oil’s problems spill into Houston’s oil sectors just as they do in Midland or Odessa, with the difference being that oil’s damage is better disguised by Houston’s diversification into the U.S. economy.
The U.S. oil industry has been struggling since 2014, had already entered another downturn in 2018-19 before COVID, and then the industry found its worst point in its modern history after COVID arrived. The fracking business, in particular, continues to struggle. As we go through this update, we will find oil to be a recurring problem in Houston and one that continues even after COVID fades into history.
Houston’s Economy Now
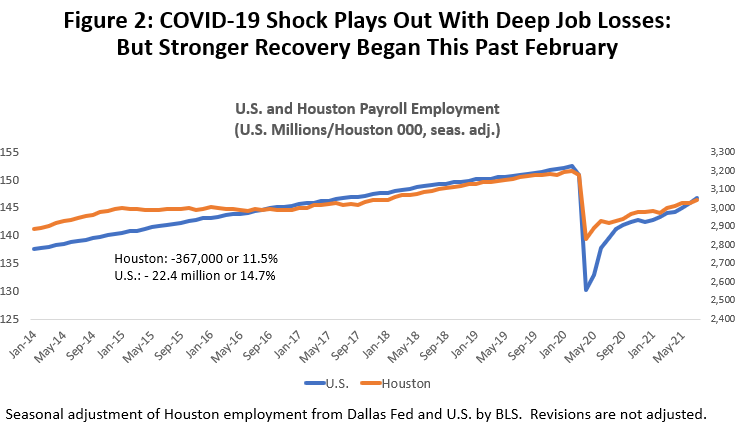
The spring of 2020 saw the virus leave economic data of every description and everywhere looking much alike — as if someone with a fishing pole had dropped a line off the side of a bridge — with the pole being trend growth to 2020 and the lockdown the fishing line falling into the water. Figure 2 shows how this distinctive COVID shape is shared by both Houston and U.S. employment. The chart shows the sudden March/April collapse of payroll employment that saw 22.4 million U.S. jobs disappear or 14.7 percent, while Houston lost 367,000 jobs or 11.5 percent. How bad was this? Compare this two-month decline to previous Houston’s worst-ever cyclical loss of 212,000 jobs during the oil bust of 1982-87.
In Figure 2 we see a deeper U.S. recession than Houston and much quicker recovery. The downturn was deeper in the rest of the U.S. because the Texas public health regulations were less stringent, and early phases of recovery saw the U.S. bounce back faster for the same reason. Our comparisons of Houston to other U.S. Texas metropolitan areas were fair because Texas shared the same public health rules across the state. But to compare the U.S. and Houston today, after public health rules have been substantially relaxed under differing sets of rules, we should just ask how far we are today from restoring total pre-COVID payroll. Figure 1 shows that on this score Texas recovery sees payroll employment at 97.2 percent of pre-pandemic levels, while the U.S. has returned to 96.3 percent. Houston still trails both with 95.1 percent of pre-lockdown jobs back.
Heavy job losses have been the dominant feature of the COVID-19 downturn with most of the lay-offs driven by social distancing. Social distancing can be reactive behavior by the public from fear of contagion, and in past epidemics the prime targets were retail stores, bars and restaurants, and personal services like barbers and hairdressers. Alternatively, social distancing can be mandated by public orders to limit mobility, close schools and nonessential businesses, or prevent public gatherings.
The COVID crisis brought a new wrinkle early in 2020 with widespread and mandatory stay-home orders for nonessential workers and the closing of nonessential businesses. While earlier epidemics had used such nonpharmaceutical interventions, the scale and simultaneous timing of the COVID lockdown orders across virtually every American city were unprecedented. Both reactive and mandatory social distancing were at work in March and April, but the abruptness and extent of the economic shock was mostly precipitated by the public health mandates and lockdowns.
Figure 3 lists nine sectors in Houston that are particularly sensitive to social distancing along with their 2019 average employment. Three large sectors — health care, retail, and food service — dominate the list in terms of numbers of workers, and the nine service industries together accounted for 41.9 percent of all Houston payrolls in 2019. However, 70.0% percent of the lockdown job losses came directly from these nine contact-sensitive sectors.
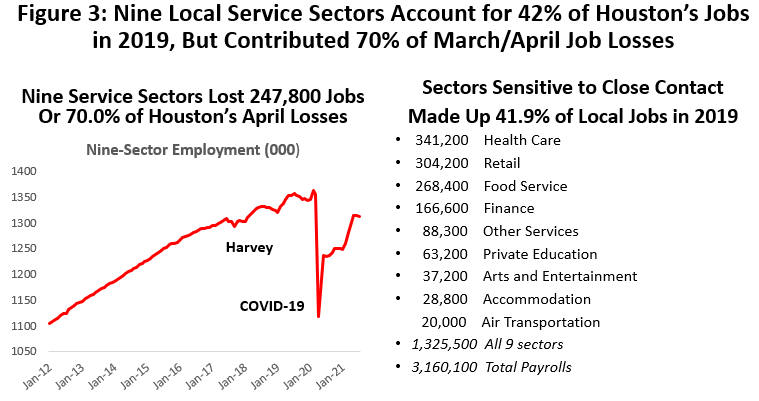
Figure 4 compares the recent monthly changes in these nine sectors in Houston to the change in total employment, with both measures bouncing back in May and June after the lockdown. Only 26.9 percent of total payrolls returned before slowing sharply in July, and few additional jobs were added back until spring of this year. Oil probably has a role in the long delay in bringing jobs back after summer 2020, but the bigger factor creating this jobs ceiling was continued reactive social distancing and the many public orders that remained in place.
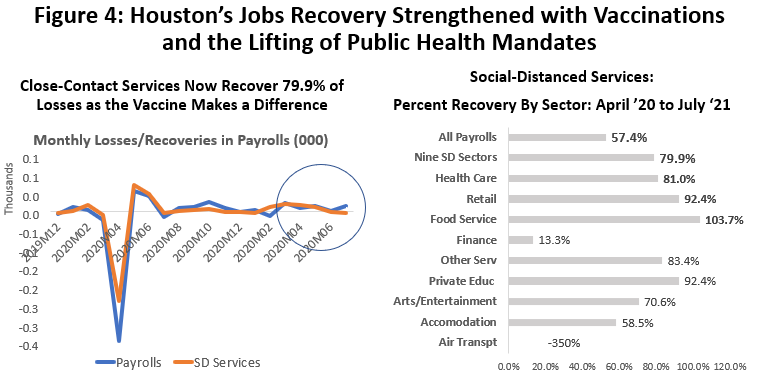
A solid pickup in employment began this March and job gains have continued through July, strongly telling us that much progress in job growth was stymied until the vaccine became available. We have now brought back 57.4 percent of Houston’s total lockdown losses — but 79.9 percent of losses in the nine COVID service sectors. The three biggest COVID sectors all rank high in making the most progress: Health Care at 81.0%, Retail 92.4%, and Food Service 103.7%. It is now losses in the oil sector, the broader economic base, and the business cycle that have become the drag on Houston’s recovery and growth.
The local unemployment rate has behaved much like payroll employment, with recovery stalling in the summer of 2020 before improving nicely this spring. Houston’s unemployment rate peaked in April 2020 at 14.4%, but the recovery of jobs through July 2020 allowed it to fall quickly back to 8-9 percent as the lockdown ended. (Figure 5.) It then stuck near that level until this spring when the vaccine arrived. With recent on-going acceleration of the recovery, the latest July reading was 5.9 percent.
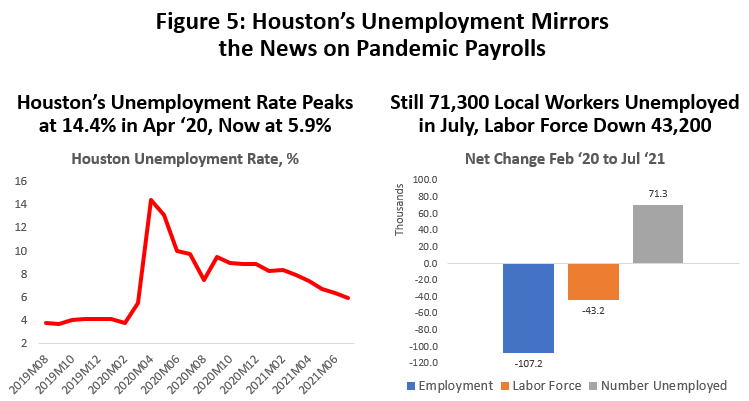
The current unemployment rate is now well below the peak of the Great Recession which stood at 8.6 percent in December 2009, but it is still well above the pre-pandemic mark of 4.0 percent. There are still 71,300 unemployed Houstonians had jobs before the pandemic, and another 43,2000 that are out of work but not counted as formally unemployed because they became discouraged about job prospects and quit looking for work.
Income
The COVID employment data presented a frightening economic landscape that became the economic focus of the public and press. The lockdowns and massive job losses generated widespread fear and a profound economic shock. However, when look at the personal income data for the same period, it shows rising disposable income, record levels of retail sales and other big-ticket spending, and personal savings rising by hundreds of billions of dollars. These extra dollars did not reduce the number of people out of work, but they did replace all the personal income that was lost following the April lockdown — and more. The difference, of course, was the trillions in fiscal stimulus payments from the federal government and emergency monetary stimulus from the Federal Reserve. Since the lockdown ended, Americans have been — collectively if not individually — richer than ever before.
The national accounting rules for fiscal stimulus can be misleading in the current pandemic context. Under these rules, stimulus certainly does not directly change the short-run employment or unemployment numbers, and because it is not current production it does not count in GDP or help determine whether recession is underway or how deep it is. But it matters in personal income, consumer spending, and saving, and specifically in understanding the current record level of retail sales and heavy spending on big-ticket autos and homes.
The amount and composition of the first round of stimulus last March is summarized in Figure 6, with $2.5 trillion in spending listed on the left side of the chart. Just over half the money was funneled almost directly to individuals or small businesses. Federal Reserve monetary stimulus is seen on the right side, showing the return of 2008-09 monetary policy with zero interest rates, expansion of the Fed’s balance sheet, and restoration of emergency credit facilities. Special Fed credit facilities similar to those of the Great Recession returned, and new Treasury/Fed facilities were created to extend credit. All of these are now closed.
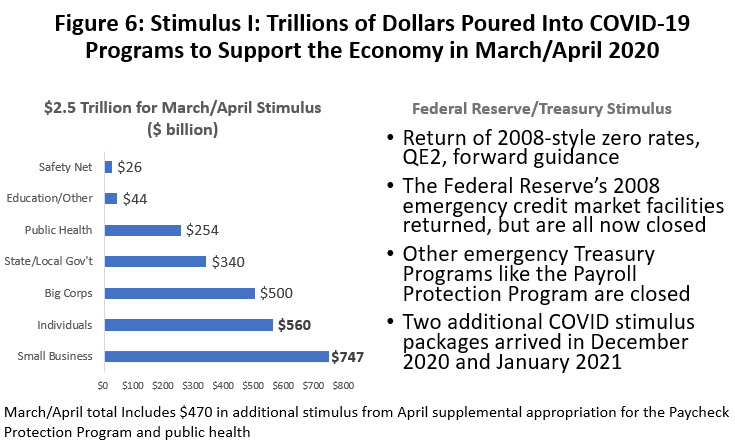
Figure 7 quickly summarizes the impact of the two most recent federal stimulus packages worth $2.7 trillion. Like the earlier spending, about half the money is channeled to individuals and small businesses, and it had an immediate impact on income and spending. The other half of these funds target virus relief much less directly than the first package and the impact on spending will be less immediate.
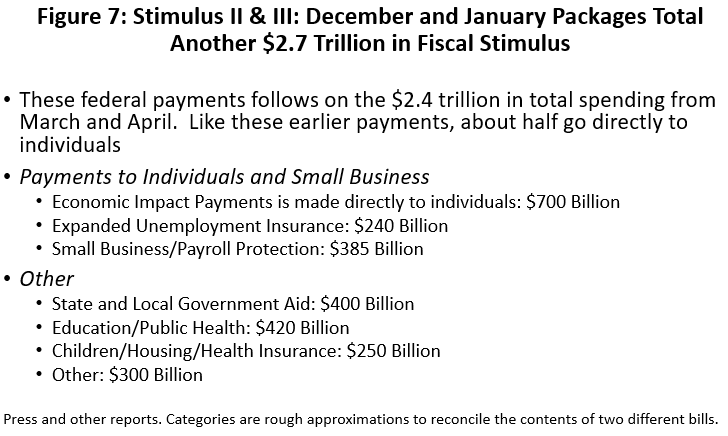
Figure 8 shows the broad economic impact of the stimulus through July of this year. The chart on the left is exactly like the chart from Figure 2, again showing the “fishing pole/fishing line” figure with the dramatic drop in payroll employment. The blue line on the right-side chart is the fishing pole turned upside down, showing the “trillion-dollar shock” to personal income engendered by the stimulus payments. This is a large positive shock. As serious as the employment damage has been, all the income lost to unemployment was fully replaced by early stimulus. The broken red line shows the arrival of the second and third rounds in total personal income. Personal income and continues at levels 8.1 percent above early 2020.
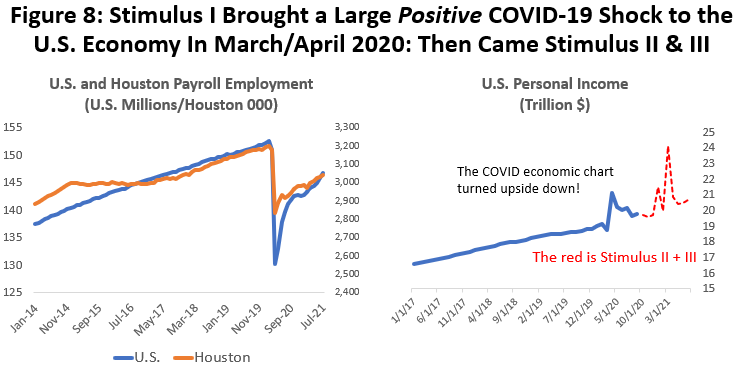
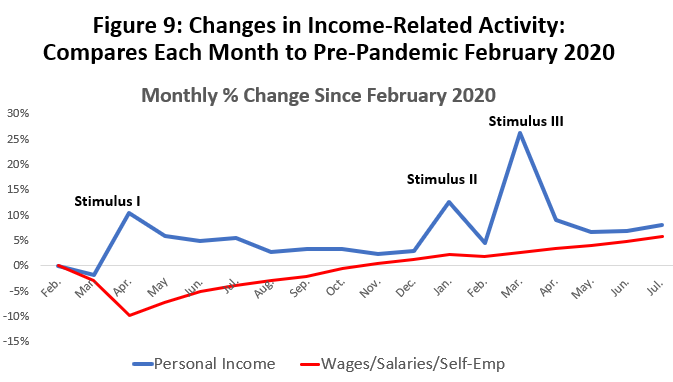
Figure 9 makes the impact on personal income more concrete. Both lines compare a measure of the level of income to its level in February before the pandemic. If above zero, we indicate levels of activity stronger than before the pandemic started, and negative if below.
The red line compares wages, salaries, and the earnings of the self-employed to pre-pandemic levels. This is the largest single piece of personal income — our paychecks — and is not tied to stimulus. It took a hit of 9.8 percent when the pandemic arrived, but slowly struggled back to pre-pandemic levels by November 2020. Since the arrival of the vaccine, wages and salaries have been growing steadily even as the stimulus wears off, and this July they were 5.7 percent above pre-pandemic levels.
The blue line is total personal income including the stimulus. It shows the very large and immediate impact of Stimulus I on personal income in April 2020, quickly pushing income 10.3 percent above pre-pandemic levels. By late 2020, the positive effects of the stimulus were slowly wearing off but were renewed by Stimulus II and III which again pushed personal income to all-time highs. Now that stimulus is unlikely to be renewed, it will be up to wages and salaries to carry the load for future income growth.
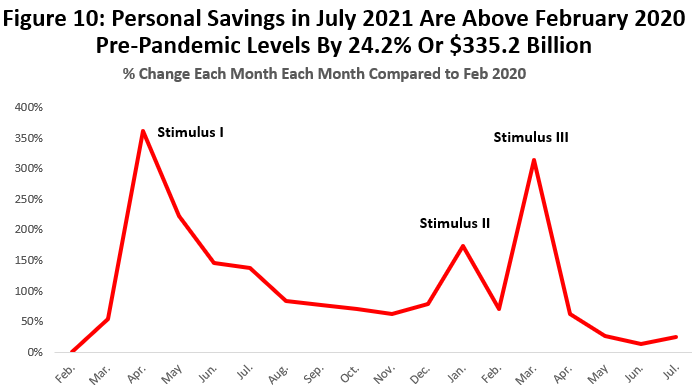
Personal savings during the pandemic initially tripled with the first round of stimulus, fell back to “only” 60 percent above pre-pandemic levels late in 2020, and then tripled again in March 2021. American have proved adept at spending these dollars from heaven, and by this July the savings advantage over pre-COVID levels had shrunk to 24.2 percent or $335.2 billion. But even as the pandemic ends, there is still an ample emergency reserve. See Figure 10.
The stimulus explains the heavy levels of spending on retail sales throughout the pandemic. (Figure 11) Retail sales returned to pre-pandemic levels by July 2020 and the latest July data shows spending still 17.5 percent above pre-pandemic levels. Sales have slipped back from a record April as stimulus wore off, but only by about one percentage point so far. Note the definition of retail sales used in Figure 11 is broad, including auto sales, restaurants, and e-commerce, for example.
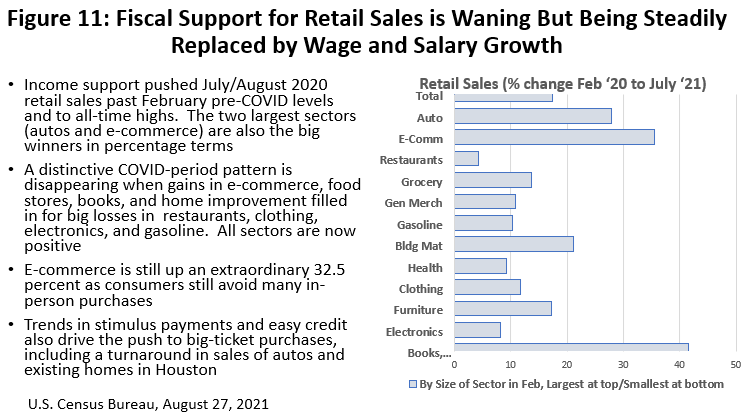
The chart shows percentage differences in retail sales between this July and the pre-COVID peak February 2020 peak, with specific sectors arranged from largest to smallest by total sales as we move from top to bottom. Among the largest sectors, big-ticket auto sales were up by 27.8 percent, e-commerce by 35.6 percent, and restaurants had finally turned positive at a plus-4.2 percent.
Just a few months ago, the chart reflected a clear COVID-driven pattern of large losses in sectors like food service, gasoline, and clothing, while groceries, e-commerce, building materials, and books and hobbies stood out as clear winners. The disappearance of this distinctive COVID pattern coincides with the arrival of the vaccine and reduced fear of the virus.
Is Houston sharing in this surge in local income? There is no reason why we would not be fully engaged in both the pandemic and the resulting fiscal programs. The taxable retail sales data for Houston is available only through the fourth quarter of 2020, but it shows an immediate increase in retail of 12.5 percent once the lockdown period ended in the metropolitan area, following a decline in the first two quarters of the pandemic of 10.5 percent. The fourth quarter then flattened out, no doubt waiting for the distribution of the second and third round of stimulus payments.
Local auto and truck sales fell 41 percent to 14,200 units when the pandemic hit and lockdowns began, but then steadily rose to match pre-pandemic levels at 23,600 by December. The latest rounds of stimulus spending then saw sales spike to 30,200 units in March of this year and stay at high levels through June, only to fall back to 22,000 units in July as stimulus finally waned.
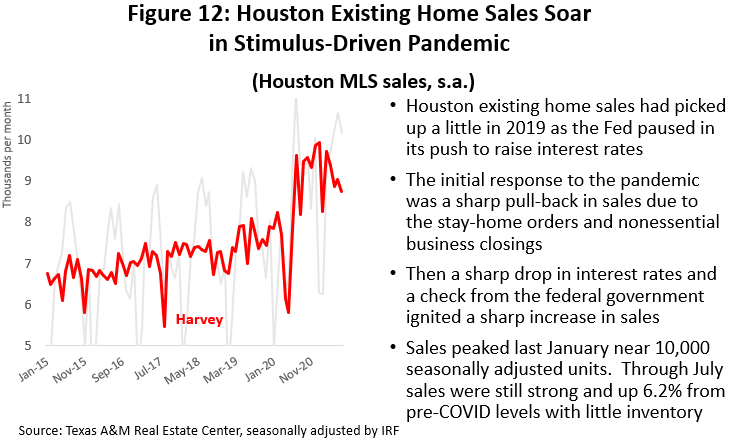
Everything related to Houston single-family housing is booming. Low interest rates are playing a role, stimulus checks helped with the down payment, and having your spouse and school-age children home for 24 hours a day argued for an extra bedroom or two. Figure 12 shows the early pandemic collapse in sales of existing homes during the stay-home orders, followed by an on-going surge to seasonally-adjusted 10,000 units by January. Sales have peaked with the end of fiscal stimulus, but still are running 6.2% above pre-pandemic levels. Existing home inventory fell from an already low 3.5-month supply in February to only 1.6 months in July. The shock absorber for strong demand and zero supply was a jump in the median single-family price by 19.8%. This summer saw the median-priced home in Houston cross the $300,000 threshold.
How Bad Is it?
How bad was this downturn? The employment figures show a devastating recession, while the personal income data and spending point to continued good times. Since March 2020, I have argued that the outcome of the current pandemic for Houston would be a moderate to serious recession once gains from stimulus payments offset and stabilized losses from wild swings in employment. Moderate U.S. recession associated with a severe pandemic was also the outcome expected from several studies of similar health emergencies from the past.2 It is now increasingly clear that we have seen a serious pandemic-driven economic setback in Houston, but not nearly as bad as widely advertised when it was happening — and nothing we have not met in previous downturns.
The Houston Purchasing Managers’ Index provides a broad survey measure of local growth that is apart from official statistics and is not tied directly to employment or income. The index is shown in Figure 13 along with a similar U.S. index, and index values below 50 indicating contraction and above 50 expansion. Houston’s contractions have sometimes coincided with U.S. recession (2000-01 U.S. recession, Great Recession) or at other times gone their own way with help from oil (Asian Financial Crisis, Fracking Bust).
The COVID-19 decline was quite short according to this index with the U.S. and Houston registering only three consecutive months of contraction, and although the decline was deep, it did not quite match the Great Recession or Fracking Bust. So yes, it was a serious decline in the local economy, but by this measure it is a cyclical event we have seen in Houston’s past.
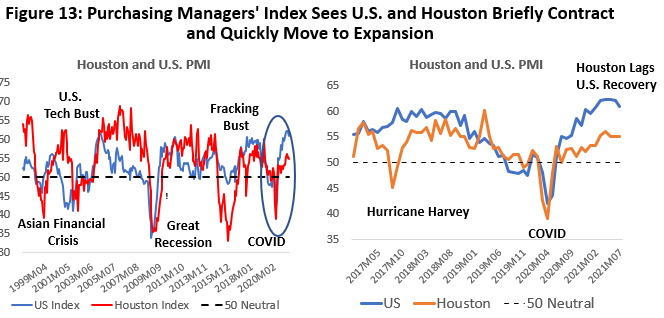
Looking at the more recent data in the right hand chart, we see the local economy currently sits on a line somewhere between moderate to strong growth. Local growth is positive through July but much slower than the rest of the country. While the index tells us little about the level of the economy, just its direction and rate of change, this slow progress again confirms Houston status as laggard in the state and national recovery.
There is another way to ask how serious this downturn was — the regional economic base. To find the key drivers of expansion and contraction in a local economy, economists often look at a select group of sectors called the economic base.3 Basic industries are those that export their goods and services to the rest of the state, nation, or world. Exports bring fresh revenue and income into the metro area, drive local expansion, and create growth opportunities among secondary, inherently local activities like bars, restaurants, retail, dry cleaners, barbers, or most of health care.
When COVID stuck, most of the impact of social-distancing fell on the secondary industries with little ability to affect regional growth. The base, meanwhile, was initially little concerned with Houston’s local lockdown. After all, base customers were not here but scattered across the state or around the world. But when the lockdown rules and the economic setback turned national and global, Houston’s decline suddenly included the economic base.
The base and the contact-sensitive jobs fell hard and at almost the same time, but they don’t have to recover at the same time. Vaccines are strongly clearing the way for a return of contact-sensitive activity. But the base is less fortunate. While progress on vaccination is moving forward rapidly in the U.S. and Europe, there is less progress and less global recovery. Similarly, while there is solid progress in Houston’s secondary sectors like bars and retail, we see much less momentum in the key base jobs.
Figure 14 shows that historically about half of Houston’s economic base has stemmed from oil and gas, while the other half is export-oriented industries that depend on the national business cycle. The right side of the figure shows how the total base — oil plus not-oil — has moved through a 2018-19 oil-industry credit crunch and then the pandemic. During the COVID collapse — between February 2020 and February 2021 — 87,700 of these important cyclical drivers were lost.
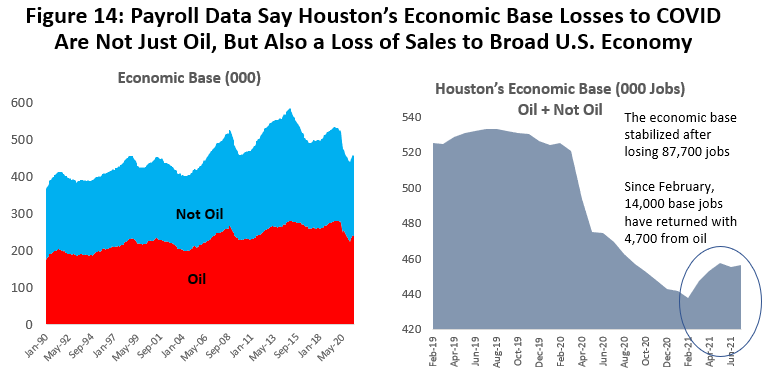
Most of the pain from these base losses was concentrated in U.S.-oriented industries which sustained 55,000 lost jobs, while the oil base fell by 32,700. Instead of quickly finding their footing after the lockdown ended, the base losses — oil and non-oil — simply continued to mount through February of this year. Losses stabilized in February, and by this July 18,500 base jobs were back (4,700 in oil), accounting for the return of only 21.1 percent of the base losses.
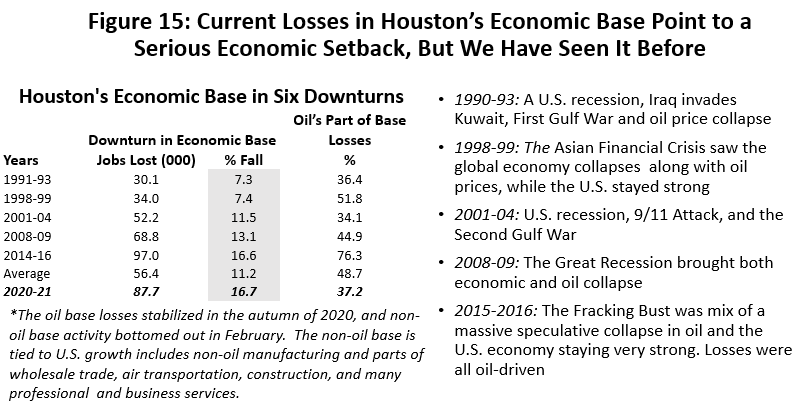
These losses to Houston’s economic base would indicate a serious local recession, with its drivers being a moderate to serious U.S. recession combined with damage from oil. See Figure 15. Oil-related damage to Houston’s economy is an inherent part of the local business cycle and has come in every Houston downturn since 1990. For the last five cyclical setbacks since 1990 the average loss of jobs in Houston’s base was 56,400, and at the worst moments of this downturn basic losses totaled 87,700 or 16.7 percent. This would rank among Houston’s worst setbacks: the 2014-16 Fracking Bust lost 16.6 percent of base jobs and the Great Recession lost 13.1 percent. Again, by this measure, the COVID downturn in Houston settles out as a serious but not unprecedented economic event.
Progress From Here?
How do we think about this recovery? We have restored 57.4 percent of Houston’s lockdown losses through July and currently lag the rest of the country in bringing jobs back. Further recovery will come from three sources that should follow one after the other and into 2023: the COVID distance-sensitive jobs are already returning first as the vaccine is effective and public health restrictions are lifted, followed by the economic base jobs that must wait for the national and global economy to heal, and finally a slower return of oil-related jobs in late 2022 and beyond.
The last of the COVID social-distancing losses return slowly through the rest of this year as we wait for broader public vaccination, for school to begin in September to free up many low-wage caretakers, and for the end of all federal pandemic unemployment payments. We have already made great progress in bringing back many of these social-distancing jobs, with recovery of 79.9 percent of jobs among our nine COVID-sensitive sectors, for example.
The economic base is about our capacity to sell to the rest of the nation or world, and it drives the critical pieces of the local business cycle. The national recovery in employment is expected sometime in mid-to-late 2022, and the global GDP data is also forecast to return to pre-pandemic levels next year. This brings local non-oil activity back on track by sometime next year. And while global oil demand may return to pre-pandemic levels in late 2022, U.S. oil recovery and employment is on its own slower path. This is discussed below.
Slow Recovery Underway in Oil
Oil prices returned to near $70 per barrel in recent months but be careful with what this means for Houston. (Figure 16) It does not imply a rush back into the oil fields, as indicated by the slow recovery seen so far in U.S. oil-field activity and Houston’s oil-related jobs. This oil price improvement is primarily from the support of large and on-going production cuts by members of OPEC+.
Oil demand is still weak. From pre-pandemic highs near 100 million barrels per day, global oil demand fell to 91.0 million in 2020, and the International Energy Agency forecasts demand to rise to only 96.2 million barrels this year and back to 99.4 million next year. Any global oil demand forecast is still conditioned by serious and on-going pandemics in large countries like India and Brazil that lack good access to the vaccine. And the global threat posed by new COVID variants remains with us.
The strong reliance of oil prices on OPEC+ puts current high prices and any price forecast at substantial risk. Cartel members are known for a history of noncompliance OPEC’s production cuts, and the Saudis/Russians relationship is one of oil-price convenience marked by animosity on many other fronts. Renewed Iranian compliance with the nuclear deal in exchange for relief from oil sanctions is sought by the Biden administration, but with prospects currently in limbo. The agreement would allow Iran to export 1.5 million barrels of oil per day, plus another estimated 70 million barrels that is thought to hold in storage.
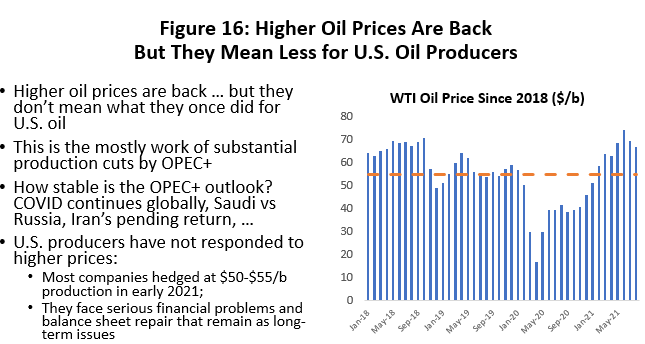
Meanwhile, U.S. producers have responded slowly in their expansion of oil-field activity. Many producers hedged their production early in 2021 at oil prices near $50-$55, and that left higher market prices meaning little to them through mid-year. As we discuss further below, U.S. producers also have been forced to make deep cuts in capital spending to appease current investors and attract new ones. Many have committed to holding the line on expansion of production until world growth stabilizes and OPEC spare capacity has been absorbed. This is a formula for higher oil prices — but not for increases in capital spending, rig counts, or new oil jobs.
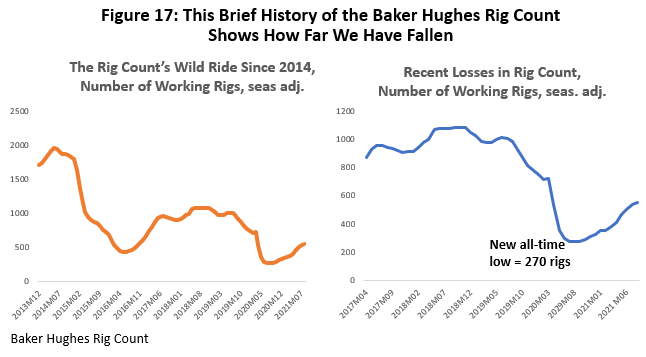
Slow and methodical recovery is underway in the oil fields, and Figure 17 shows the latest data on the rig count. Working rigs have made only limited progress over the past year. In 2016 the rig count fell from near 2000 rigs in 2014 to a seasonally-adjusted all-time low of 433. The pandemic then crushed this record in August 2020 with a fall to 267 rigs. By August, the rig count averaged 555, still only 54.8 percent of the rigs working at the last oil-field peak in August 2019.
As a leading indicator of oil-field activity, the rig count has long been the industry bellwether in terms of the outlook for hiring and oil production. But current events and the structure of the fracking industry have modified this perspective, though not displaced it. Fracking requires two major stages that each entail similar costs, but which are timed differently and bring different industry resources to bear.
After a well is drilled and the rig is removed, it may be days, weeks, or months before another crew and a fleet of trucks and equipment arrives to pressurize, fracture and complete the well. This lag between first and second stage leaves an inventory of wells that are drilled but uncompleted (DUCs) and await further work. The industry was holding a large inventory of such wells as the pandemic began, and as it struggles with capital constraints, it made sense to first turn to fracking and completion as the least costly way to replace reserves or expand production.
According to the Department of Energy, there were about 9,000 such wells waiting for completion before the pandemic began. This was a very large backlog left over from 2019, but the number has since fallen steadily to under 6,000 by last July. This decline is seen on the left side of Figure 20, while the right side shows the month-to-month change in the number of DUCs. Since the oil-market collapse May 2020, the number of DUCs has shrunk by an average of 203 per month, and in recent months this accelerated to a steady decline of 200-300. However, the current inventory is now thought to be near steady-state levels, i.e., backlogs are normal at the current levels of drilling with few left as excess inventory. The easy increases in production from DUCs is over.
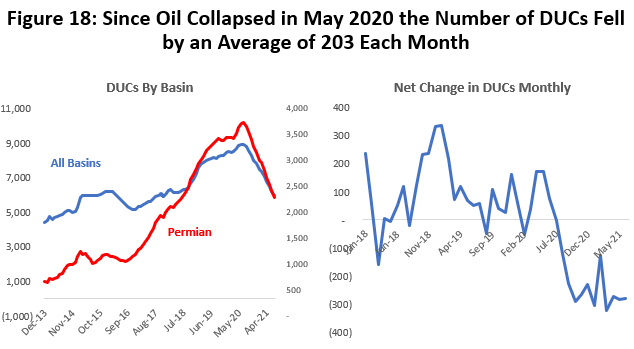
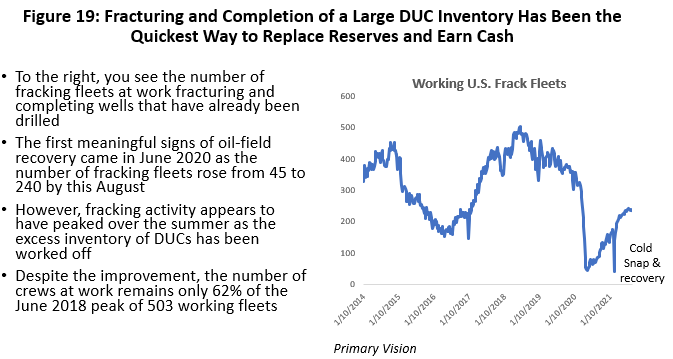
Figure 20 is a measure of the number of fracking crews at work, and after the May 2020 collapse in activity this work began to rise earlier than the rig count. As the inventory of DUCs began to stabilize, the number of frac crews has also flattened out through the summer at a steady 230-240. This is about 60 percent of the previous 2018 peak in fracking activity.
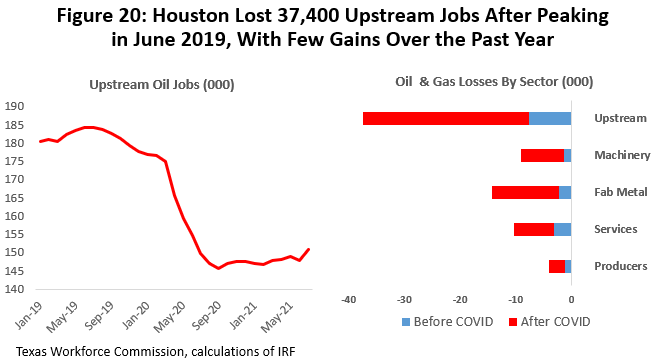
The trough in local oil-related employment came in February of this year after Houston lost 37,400 upstream jobs measured from the June 2019 peak, and far fewer than half of the 77,200 losses during the 2015-16 Fracking Bust. The 2015-16 collapse in Houston jobs resulted from a bubble that burst in U.S. fracking after the price of oil fell hard in late 2014. Oil jobs hung on far better this time because the local job market had been right-sized by early 2020. Many of the jobs oil lost this time will return — but not quickly or soon. Producers have promised few gains in drilling activity or hiring until world oil markets are healthy again, pushing significant oil-field expansion out to at least late 2022.
Figure 20 shows changes in upstream oil jobs: producers, services, machinery, and fabricated metal. They are measure from (1) the beginning of the 2018-19 credit crunch and before COVID, and (2) after the COVID-19 outbreak in February 2020. The data to July still show oil-related job growth near a standstill. Not surprisingly, almost all the upstream losses have been in oil services and closely-related machinery industries.
The oil downturn began before COVID-19 because of a serious industrywide credit crunch in the fracking industry. In terms of the number of losses, the COVID period of collapse was by far the most serious part of the downturn, but the on-going slow and partial recovery in rigs, completions, and jobs has as much to do with those pre-COVID credit problems as with COVID. There was a need to completely rethink the financial model for the fracking industry, and this is now well underway. Looking forward, this new financial model will bring a smaller U.S. oil industry in its wake, and slower-growth to the Houston metro area.
The Other Problem: Oil and the Fracking Business
We have produced several recent reports and presentations with detailed discussions of the recent dilemma now faced by the U.S. fracking industry, including a recent paper from this past March.4 This section of this report summarize key issues laid out at length last March.
Growth of tight oil and natural gas exploded in the early 2000s, and it has since been boom or bust for American fracking. U.S. oil production boomed at 24.6 percent annual growth rates from 2004-2014 as a result of OPEC driving $100 oil prices, zero interest rates from the central bank, and speculative excesses by the fracking industry and those who financed it. Both boom and bust rivaled the 1980s. The fracking bubble burst in 2015-16, but it took until 2018 and rising interest rates from the Federal Reserve before the last avenue of growth was cut off from this capital-intensive industry.
With oil prices at $55-$60 in 2018-19, the fracking industry proved unable to deliver adequate profits or increased equity values. Living off $100 oil had been easy, but too many companies had thought of themselves as a tech stock driving capital gains and had spent too little time building a solid oil company. The result was that Wall Street effectively turned its back on the fracking business and triggered an industrywide credit crunch in 2018. The rig count and oil employment were in full retreat by 2019, followed in early 2020 by the pandemic and another severe collapse in oil prices and U.S. oil-field activity.
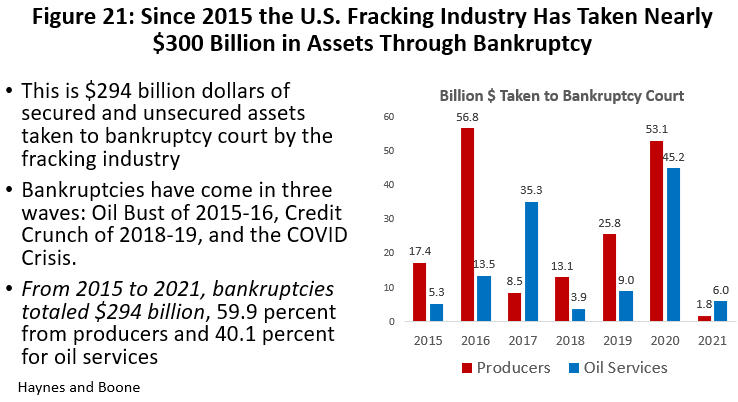
The industry went through three rounds of major bankruptcy: one that accompanied the 2015-16 fracking bust, a second with the 2018-19 credit crunch, and then the pandemic oil collapse. See Figure 21. Since 2015 the industry has taken $2 billion in secured and unsecured assets through bankruptcy court, divided 60/40 between oil producers and their service companies.5 It is no wonder that Wall Street effectively turned its back on the fracking business in 2018.
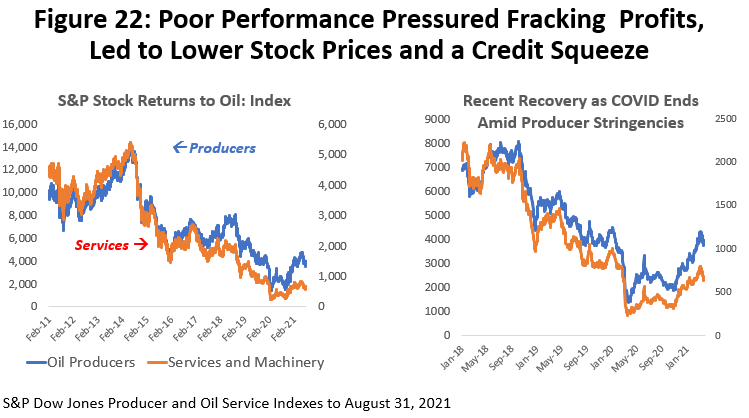
This financial collapse is demonstrated in Figure 22 by the values of the S&P Producer and Oil Service and Machinery Indexes. There was no substantial recovery in equity values after 2016, and after leveling off through 2017 stock values were again in full retreat by 2018-19. Equity is a relatively small part of the industry’s overall financial picture, but its setback sent a clear signal of general financial stress. The data began to improve — both in the number of bankruptcies and stock values — in the first quarter of this year as the fracking industry adopted a new financial philosophy.
The industry finally has accepted that it is no longer a high-flying tech stock, that it is a high-cost source of oil that functions best with oil prices near $60-$65 per barrel, and it is a capital-intensive industry that must somehow seek out and mollify thrice-burned investors. The industry has collectively decided that to attract capital it must behave like a value stock, i.e., paying dividends by diverting 10-40 percent of its free cash flow to clean up its balance sheet and reward investors with substantial and reliable dividends.
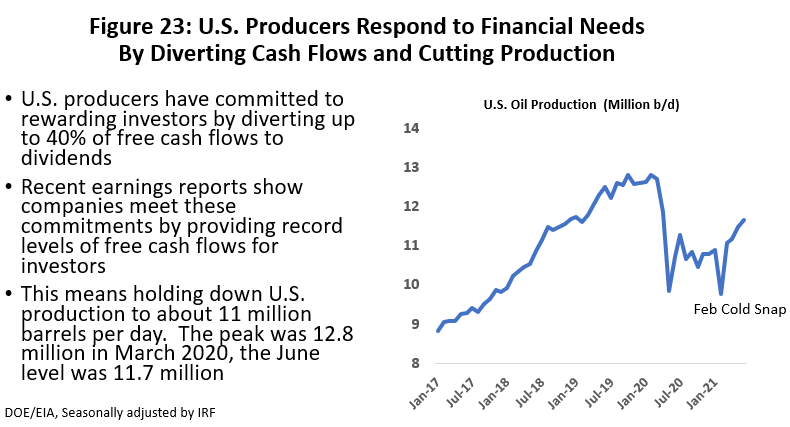
Diverting substantial portions of cash flows to investors also means diverting cash away from drilling, production, and employment. First and second quarter earnings reports from many companies show this philosophy is being widely adopted and that investors responded positively. However, fracking companies have also made it clear that they will hold the line on oil production at or near current low pandemic levels. Figure 23 shows U.S. production peaking at 12.7 million barrels per day as the pandemic arrived, falling as low as 10.2 million, and then settling near 11.5 million. Producers plan to hold production at this level until the global economy heals and OPEC spare capacity is eliminated.
Stronger cash flows associated with better pricing will be used to improve the financial position of the company and its investors. Meanwhile, expect limited gains in drilling, production or employment in coming quarters. Maintaining or raising production levels will be made more difficult with the large inventory of DUCs from 2019 having been depleted.
Oil's Future in Houston
When growth resumes, fracking will be a smaller and slower-growing industry. It may be surprising that the adoption of a new financial model in a single industry could influence the economic outlook of a major metro area like Houston with 7.1 million people and 3.2 million payroll workers. But oil has always had a special and outsized role in the local economy since Spindletop. Houston payroll employment has grown at 2.0 percent per year since 1990, and 0.6 percentage points or about one-third of that growth stems from oil. Perhaps 0.2 to 0.3 percentage points of oil’s growth contribution in Houston is now being lost to the need to bring fracking’s financial excesses back under control. These are not temporary losses like we might see in recession or a global oil crisis, but semi-permanent losses for years to come as fracking buckles down for life under new financial limits.
But even if oil were to disappear tomorrow, the other contributors to Houston’s growth — the U.S. economy, demographics, the Texas Growth Formula — remain healthy over the long run, and Houston’s job growth would outperform the rest of the country 1.4% to 1.1%. Add back the now-smaller contribution from oil, and the comparison is 1.7%-1.8% locally to 1.1% for the U.S. These are still impressive results but will require some local belt tightening — at least compared to previous expectations.
By measures other than the number of jobs, however, the damage from oil may be more meaningful. Oil is a headquarters and research operation in Houston, providing tens of thousands of high-quality executive, engineering, and other technical jobs that pay far above average. Per capita income and retail sales, for example, will likely be hit harder than job numbers alone would indicate.
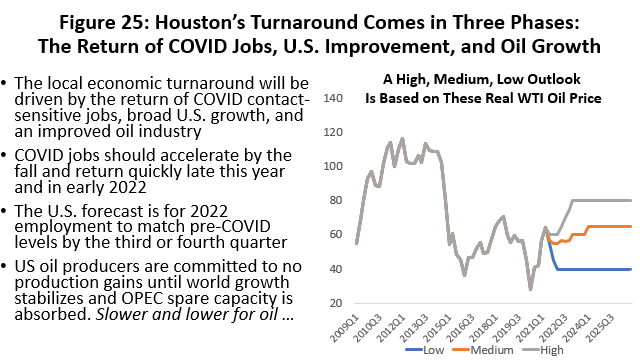
How will this financial change be reflected in our forecast of oil-field activity? Or impact Houston’s upstream oil sector and broader payroll job growth. We a assume that 30 percent of fracking’s free cash flows are diverted from capital spending to cleaning up balance sheets and rewarding investors. Oil prices still matter, of course, with oil price being the top-line determinant of industry cash flows, and we consider three oil prices: a medium case where oil returns to the long-run marginal cost of oil near $60-$65 per barrel, a low case of $40 and a high of $80. See Figure 24.
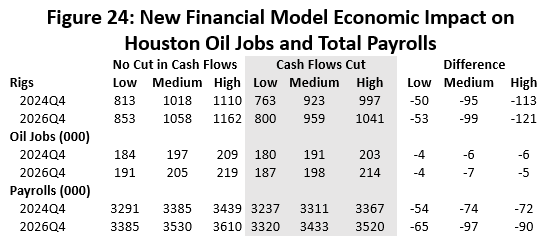
Changes are measured in 2024Q4 and 2026Q4 after COVID-19 recovery is long-since complete and economic base/business cycle impacts have had time to work their way through the economy. What is the difference between the old and new financial model in each year? Before and after cash flow cuts are made? The outcome is based on the forecast discussed in the following section: 95 few rigs operating under the medium cash-cut scenario, 50 fewer in the low, and down by 113 in the high. Local oil employment is 6000 lower in the medium projection, down 4,000 in the low, and sees 6,000 fewer in the high case. Houston’s total payroll employment will be 74,000 jobs lower in 2024Q4 compared to the medium no-cut case, down 54,000 in the low and 72,000 in the high. It means the loss of about a year’s growth in the local economy. By 2026 oil stabilizes along with assumed oil prices while payrolls grow more slowly over the extra two-year horizon.6
Houston's Employment Outlook
We know generally how payroll employment should perform over the next few quarters. We have seen a substantial return of COVID/ contact-sensitive jobs since March, and they should accelerate by this fall with a mostly complete return by mid-2022. To bring back the local base jobs that drive the business cycle, the U.S. forecast is for 2022 employment to match pre-COVID levels by the third or fourth quarter. And finally, U.S. oil producers are committed to no production gains until world growth stabilizes and OPEC spare capacity is absorbed. It is a low and slow outlook for oil until late 2022 at best.
As we pull our forecast together, we need a high, medium, and low outlook for planning purposes. See the right side of Figure 25. We use oil prices as the vehicle to spread the outlook from high to low levels. The high oil price is $80 per barrel and the low is $40. The medium or most likely price is $60-$65 per barrel, a price widely accepted as the long-run marginal cost of oil. In all cases we use the new financial model with 30 percent of industry free cash flow diverted to investors. This smaller oil industry limits expectations for regional growth.
The pieces of the puzzle needed to put together the employment forecast are in Figure 26. The blue line is recent history. It is the fishing pole/fishing line chart for employment seen several times before. It reflects a sharp drop of 282,100 jobs in the first-quarter lockdown and shows that by 2021Q2 (at the end of the blue line) we are still 151,000 jobs short of the pre-COVID beginning point.
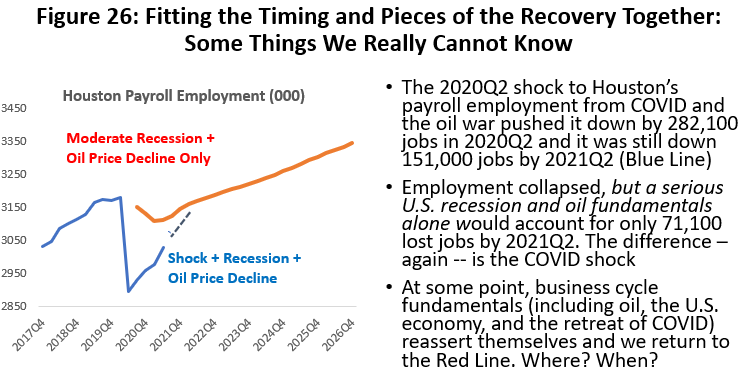
The huge drop in the blue line was the lockdown and economic shock from COVID. With the vaccine in place the fear of the virus and remaining shock will be eliminated in the coming future, and we should soon move back to an economy running on economic fundamentals. This would be a return to the red line. The red line reflects what would have happened in 2020 and 2021 if we had only experienced a moderate to serious U.S. recession and $40 oil — something we have seen several times before. The difference between the red and blue lines was COVID shock.
An effective vaccine returns us to the red line that becomes our path for future fundamental growth that stretches out to 2026Q4. The fundamentals are once more driven by the U.S. economy (from the Survey of Professional Forecasters and the Congressional Budget Office), plus the oil prices just discussed. The real question — one that cannot be answered by economists, statisticians, or epidemiologists — is exactly how we get from where we are today and back to those fundamentals. What does the connecting broken blue line in Figure 26 look like? In which quarter can we say that fundamentals are back and showing us where to connect the blue and red lines? How fast will we move along that broken line if we knew where to connect?
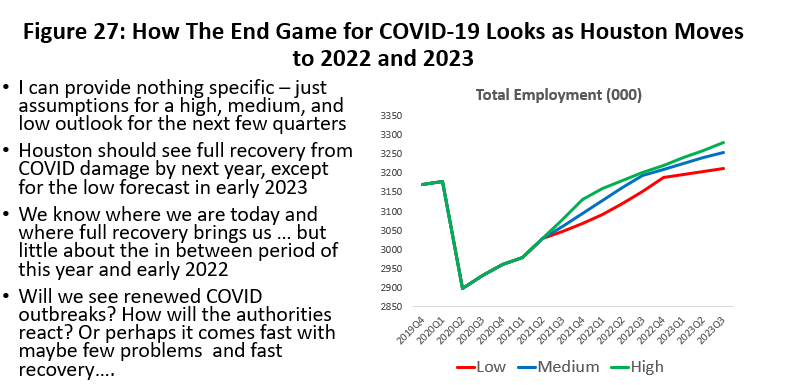
Because COVID was such a sharp break with the past, our return to basics is a matter of guesswork. We know we are moving from the current lows to better times and are generally headed in the direction of the red line. We know that COVID jobs return earlier and fastest, followed by base jobs and then oil, and we can roughly predict the timing of each wave. Because COVID and its variants are still influential for these next few quarters, Figure 27 provides three possibilities — the green high path is the earliest and fastest return to fundamentals, the red low path is slowest and latest, and the medium green is the intermediate between high and low. We cannot be much more specific.
We use this guesswork to connect where we stand today to the return of fundamentals in the low, medium, and high cases from Figure 28. The return of the contact-sensitive jobs, followed by the economic rebound, leads on the initial expansion during 2021-23, followed by the long-run recovery of jobs from 2024 to 2027 which rises more slowly and steadily. This is our forecast of Houston’s future as far as 2028.
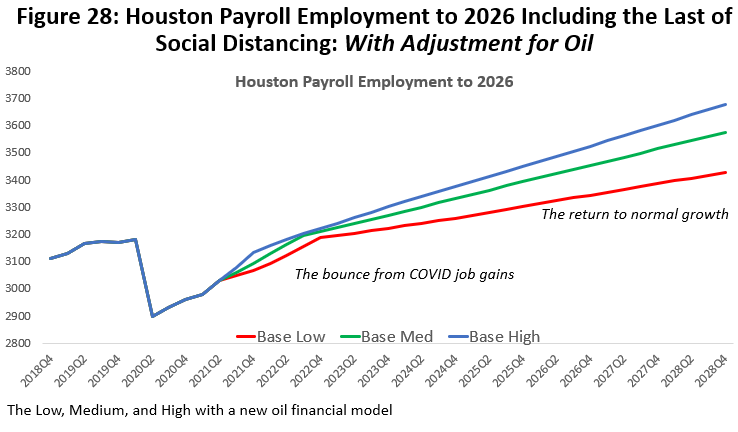
Figure 29 is a reminder that this outlook is based on a new model for fracking with a 30 percent cut to free cash flows by oil producers. The broken lines are where the forecast might have gone if the old no-cut model could have somehow prevailed as compared to the current forecast. We do not use this old model but present it simply to illustrate the impact of a smaller oil industry on Houston’s long-term growth. As discussed earlier, expect a 1.7 percent long-term growth rate as opposed to the past 2.0 percent.
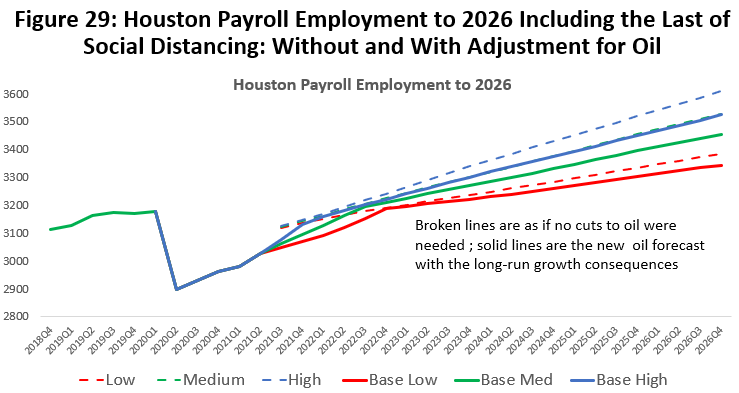
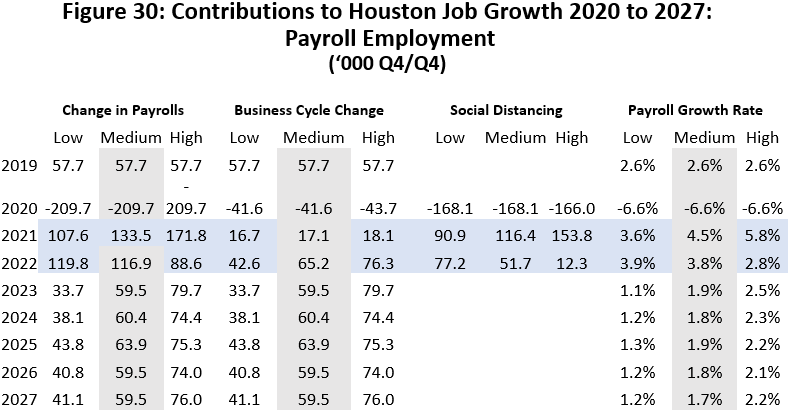
Figure 30 is the low, medium and high forecast of Houston’s payroll employment to 2027 based on annual changes measured Q4/Q4. Focus on the medium forecast and we see the loss of 209,700 jobs to the lockdown divided into 168,100 jobs due to social distancing and 41,600 cyclical jobs from base losses. This was a 6.7 percent loss to payrolls. We see a return this year of 116,400 social distancing jobs, joined by a modest 17,100 from cyclical gains. This is followed by another 51,700 COVID jobs in early 2022 and 62,500 base/cyclical jobs that continue to be added through the year. Oil jobs will contribute to growth in late 2022 and 2023 and keep cyclical growth running above trend. By 2024 we see job growth finally settle back to long-term trends and to 1.7 percent annual rates. The high forecast brings down COVID/social distancing losses faster and then moves to higher long-term trends, while the low does the opposite.
It is important to recognize that the number of returning jobs is exciting with 133,500 jobs this year and 116,900 jobs more next year, but they only bring us back to the number of jobs we had before COVID back in 2020Q1. If growth returns to pre-pandemic highs by the fourth quarter of 2022, we will have lost three years of growth to recession and recovery. And the new expansion will be moderately handicapped compared to the past because of the performance of oil. If oil is slower, the good news is that it’s new financial model should make it more stable. The gyrations of the industry since 2014 — and its unpredictable economic impacts on Houston — should be behind us for a while.
Written by Dr. Robert W. “Bill” Gilmer
September 13, 2021
University of Houston
C. T. Bauer College of Business
Institute for Regional Forecasting
1 R.W. Gilmer, “Houston After COVID-19: Taking Stock and Looking Forward?” June 15, 2021.
2 Congressional Budget Office, “A Potential Influenza Pandemic: Possible Macroeconomic Effects and Policy Issues,” revised July 27, 2006; Robert J. Barro, Joanna Weng, and Jose F. Ursúa, “The Coronavirus and the Great Influenza Pandemic: Lessons from the "Spanish Flu" for the Coronavirus's Potential Effects on Mortality and Economic Activity,” NBER Working Paper 26866, Revised April 2020.
3 Houston’s economic base contains upstream oil (producers, services, machinery, and fabricated metals) and downstream oil (refining, chemicals, and plastics). There are also pipelines, non-oil manufacturing, and selected sectors in construction, professional and business services, wholesale trade and air transportation. Calculations use location quotients for excess employment as drawn from a typical textbook. Also see Scott J. Brown, N. Edward Coulson, and Robert F. Engle, “On the Determination of the Regional Base and Regional Multipliers,” Regional Science and Urban Economics, (1992), vol. 22, pp. 619-635.
4 R.W. Gilmer, "Oil Picks Up the Pieces After Economic Shock: Recovery Now Begins for Oil Markets and Houston," Institute for Regional Forecasting, August 2020; and more recently Adriana Fernandez and R.W. Gilmer, "Houston and the Future of American Fracking," March 2021.
5 Haynes and Boone, LLP has two regular publications that monitor the number and assets involved of bankruptcies by oil producers and the oil services industry: Oil Patch Monitor and Oil Field Services Bankruptcy Monitor.
6 In these comparisons, the differences between high to high, low to low, medium to medium, then both with and without cuts to cash flows. Cash flow cuts have limited effect on the low forecast because at $40 per barrel the cash flows are already restricted. At $80 per barrel there is a still a nice boost to activity even though substantial cash flows are diverted to investors, and losses are measured as a part of much higher levels of activity. It is oil prices from $50-$65 dollars that are most responsive to cash flows decisions.