Houston Updates
-
Archive
- June 2025
- March 2025
- December 10, 2024
- September 14, 2024
- May 21, 2024
- March 19, 2024
- December 9, 2023
- June 16, 2023
- April 6, 2023
- March 17, 2023
- Dec. 19, 2022
- Sept. 14, 2022
- July 4, 2022
- March 27, 2022
- March 9, 2022
- September 2021
- April 2021
- March 2021
- September 2020
- August 2020
- June 2020
- April 2020
- March 2020
- January 2020
- December 2018
- June 2018
- March 2018
- February 2018
- January 2018
- September 2017
- September 2017 Post-Hurricane
- June 2017
- March 2017
- January 2017
- September 2016
- March 2016
- December 2015
- September 2015
- June 2015
- March 2015
- December 2014
- June 2014
- March 2014
- November 2013
- September 2013
A False Start for Oil Markets in 2017 Means Weak Prospects for Houston's Economy
September 11, 2017
In the summer of 2015, just months after the long slide in oil prices began, it appeared that an oil-market recovery was at hand. Oil prices pushed back to near $60 per barrel, petroleum inventories were falling, and the domestic rig count turned around. Then the Iran Nuclear Agreement was signed, millions of barrels per day of Iranian oil returned to market, and the oil-price rout resumed with a vengeance.
Then last November, it again seemed that the global oil glut was coming to an end, and optimism soared as OPEC committed to speed up the process by limiting its production. Oil prices were expected to quickly move to $55 and $60 per barrel, and then continue climbing in 2017. The rig count rose, oil jobs began to return in Houston, and a burst of oil-market optimism spread through the local economy.
But it has since become another false start. Both oil markets and Houston’s business community watched oil prices falter through the spring, and optimism waned rapidly. Oil prices remain mired between $45 and $50 per barrel, and price expectations – measured by the futures market for West Texas Intermediate – have fallen back to levels well below those that prevailed before the OPEC accord. The domestic rig count has peaked for now, and the big investment houses forecast a decline in U.S. drilling through the second half of 2017.
Houston’s economic data indicate that retrenchment is also underway in the local economy. July data included a small reversal in oil jobs, weaker overall job growth, a big decline in the labor force, and a purchasing manager’s survey that now predicts sluggish growth through the second half of the year. After losing 77,200 oil-related jobs, oil employment in Houston has stabilized, but it looks like relatively few of these jobs will return soon. The big question: Where does Houston go now if there is no help from oil?
What Happened to $60 Oil?1
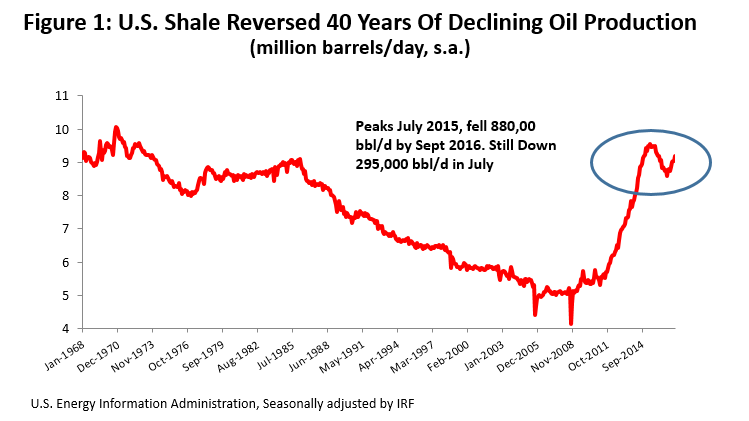
The revolution wrought by American fracking is a technical marvel, but it also leaves the industry largely responsible for the 2014 oil bust. Figure 1 shows how horizontal drilling and hydraulic fracturing reversed 40 years of declining U.S. oil production, adding just over four million barrels per day (b/d) of new production between 2011 and 2014. This oil was the only source of new non-OPEC production during this period, but it flooded into a market that had averaged annual growth of only 1.3 million b/d over the previous 20 years.
The economics of the shale revolution set it well apart from conventional oil exploration and production. In contrast to the oligopolistic markets of Shell, Exxon, and the giant national oil companies, fracking looks and behaves like a highly competitive industry: numerous small firms, low barriers to entry, and production that can be quickly ramped up or down as price changes. Unlike conventional oil, there is no significant exploration risk, making output relatively certain, and working more like an assembly line. Given these properties, if the long-run equilibrium oil price is $60 per barrel – something that both the petroleum and financial engineers tell us is true -- then producer behavior should move supply and demand into balance near that level.
The trigger for the 2014 collapse in oil prices was OPEC’s declaration that it would no longer act as swing producer, i.e., no longer withdraw oil from world markets to support price. OPEC handed that job on to American fracking, but the industry has proved messy and undisciplined in the process. U.S. production fell slowly and by nearly 900,000 b/d in response to low oil prices, but then began to rise again in late 2016. It should return to near record-high levels by year end, based on drilling already in place. New production was partly triggered by the promise of OPEC’s November efforts to rebalance oil markets, and partly by perverse incentives offered to the fracking industry.
What went haywire here? One answer seems to be too much cheap money. Producers have been outspending their cash flows again, just as they did before the oil bust, facilitated by private equity and high-yield funds that have put few limits on available cash. Instead of paying attention to profits over the oil-price cycle, producers grew oil reserves and production, hoping to impress equity markets. (See Figure 2)
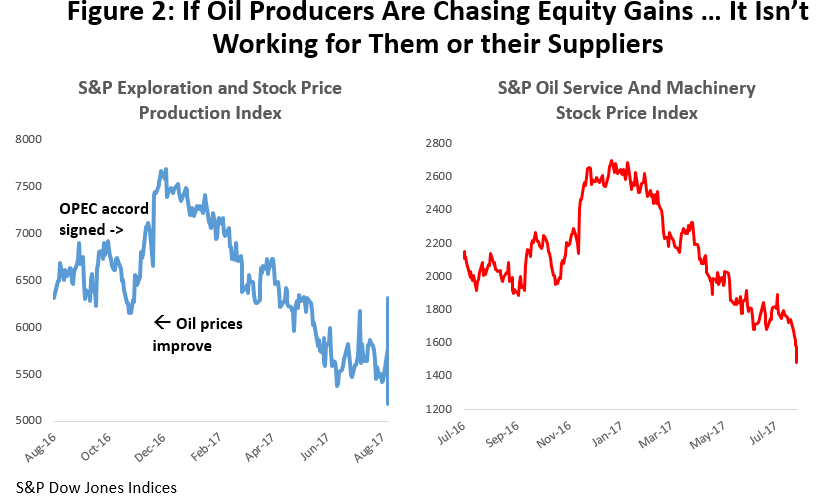
The result was to push the rig count up quickly, and collectively to expand production to unsustainable levels. If the goal was quick gains in the stock market, the strategy failed, with producer stock down by over 30 percent since December. The strategy also failed their suppliers, the oil service and machinery companies, who have experienced even bigger losses in stock prices.
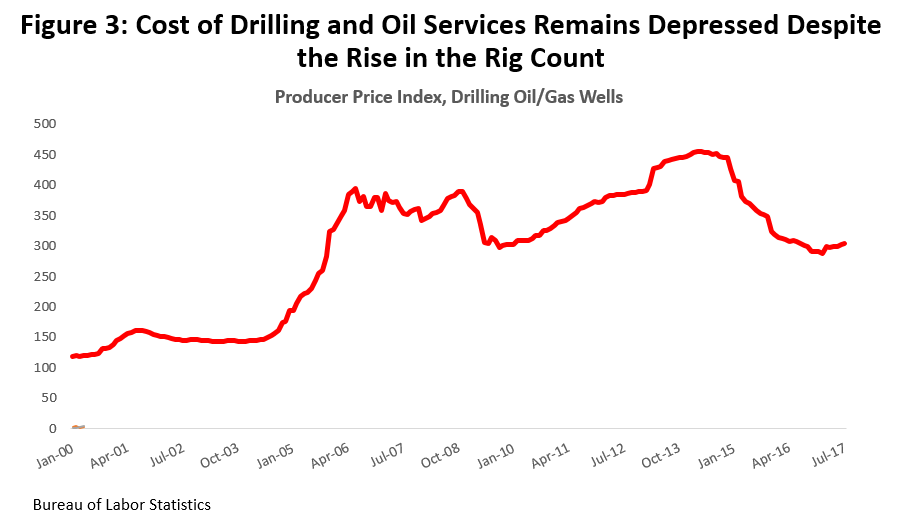
What brings these producers back into line? First, they have to be frozen out of capital markets again, as they were during the early stages of the oil bust, and when many of these same companies were working their way through bankruptcy. Second, oil service and machinery costs need to rise to reflect the total cost of exploration and production, including capital costs. With widespread over-capacity, many service and machinery companies have been pricing to cover little more than operating costs, just hoping to keep the doors open until better times.
Figure 3 shows a December 2014/December 2016 decline in drilling costs of 31.9 percent, with little recovery in recent months. The increase in the rig count has not yet been big enough to tighten capacity and improve pricing. Recent earnings reports from the giant service companies like Schlumberger and Halliburton claim they have achieved better pricing, but the rest of the supplier base remains quite depressed. These low prices are an implicit subsidy to producers, and another vehicle to enable their over-production of oil.
In summary, a highly competitive industry that should move oil output and price to stable long-run levels is living way too high on large subsidies to its capital base and operating costs. This leaves oil markets locked in a destructive cycle, one that currently has returned to the stage of overproduction and depressed price. We now stand on the brink of another pull-back in fracking and drilling activity, and another round of financial stress on individual producers.
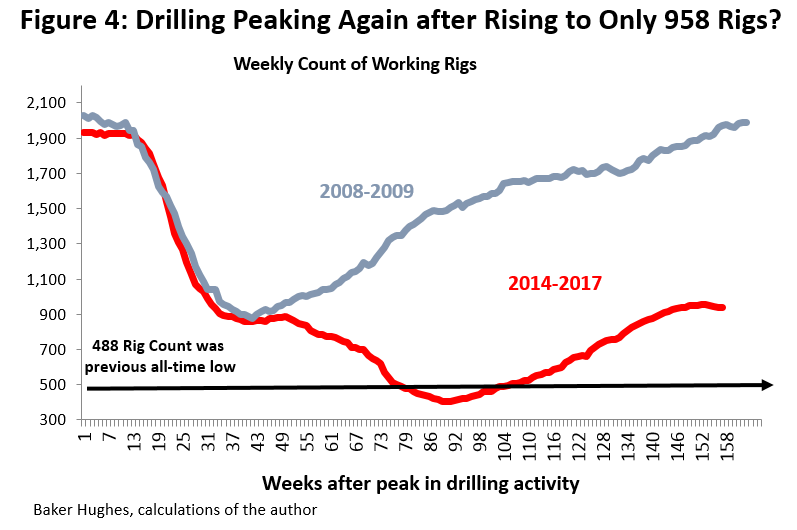
Figure 4 shows the Baker Hughes rig count over the course of this downturn, and compares it to the last cycle in 2008-09. You can see the earlier recovery attempt about 40 weeks into the 2014-16 decline, aborted by the return of Iran’s oil to market; at week 90, the rig count fell to the lowest level ever measured by Baker Hughes. Drilling activity rose steadily after June 2016, reaching a peak of 958 rigs in late July, a level that was not quite half of the previous 2014 peak.
As this is written, oil prices (apart from storm-related gyrations) are still mired near $45 per barrel, the rig count has fallen or stayed flat for 6 of the last 7 weeks, and the major investment houses are predicting a continued decline in drilling through the rest of this year. Raymond James, for example, forecasts only 850 rigs working by early 2018, when drilling activity will begin to pick up again.2 With no change in producer behavior, rising oil prices in 2018 will kick off another destructive cycle.
A Burst of Local Optimism Quickly Evaporates
The November OPEC agreement promised big gains in the oil market, and a turning point for Houston’s oil industry. Just as the oil market has now lost all its OPEC-generated enthusiasm, Houston also finds itself disappointed. As we apparently head into another setback to drilling activity, what does it mean for Houston’s growth prospects?
Houston’s economy has shown considerable resilience since 2014, even in the face of 77,000 oil-related job losses. Working to offset the loss of oil jobs were strong growth in the U.S. economy, a construction boom on the Houston Ship Channel, and sustained economic momentum from the previous decade of growth. Together these factors were just enough to keep Houston’s economy treading water with only minor losses in total employment. The Dallas Fed’s Business Cycle Index for Houston, built on a wider array of variables than just payroll employment, continues to show a possible minor recession in 2016.3
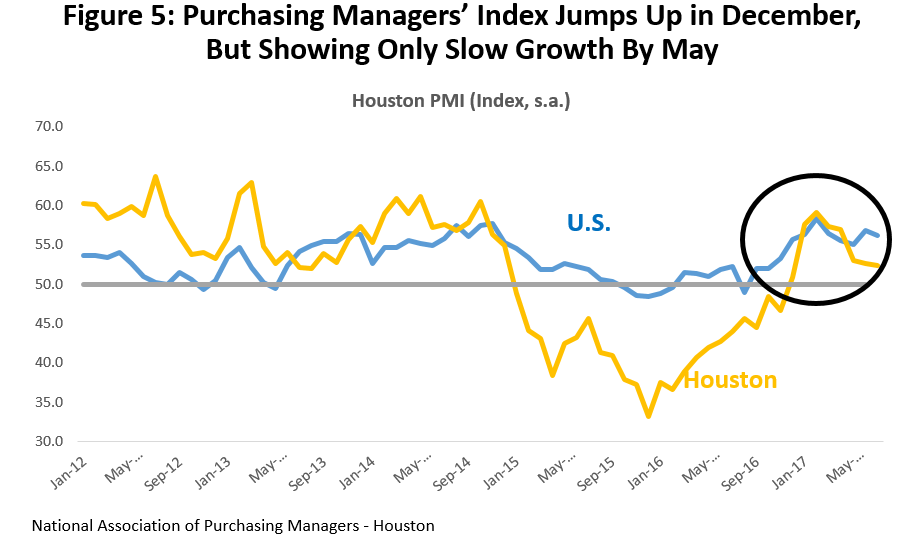
Let’s look at several local economic variables that responded strongly to the OPEC headlines early this year, only to pull back by spring. Figure 5, for example, shows the Houston Purchasing Managers’ Index, where 50 is the neutral point between expansion and contraction in the local economy. It is a leading index of economic activity, pointing to the rate of growth in coming months, and based on a monthly survey of local purchasing managers. The November 2016 index value was 46.6, indicating mild contraction, but it surged to 59.1 by February, pointing to very strong expansion ahead. Continued low oil prices pulled it back to the low 50’s by May.
The unemployment rate (Figure 6) provides a perverse example, but tells the same story. In this case, the unemployment rate rises sharply to a seasonally-adjusted 5.7 percent on the good news, only to fall much lower when it becomes clear that OPEC’s plans didn’t work out. This seemingly backward result is common for a local area in Houston’s current circumstances, where a major downturn that has left many workers unemployed for an extended period. In this case, the unemployed have relatively specialized oil skills, and many have given up on an active job search. Their professional grapevine tells them there are no jobs out there, but would also quickly let them know if hiring resumed. For official statistics, if these workers are no longer engaged in an active job search, they are not counted as either unemployed or as part of the labor force.
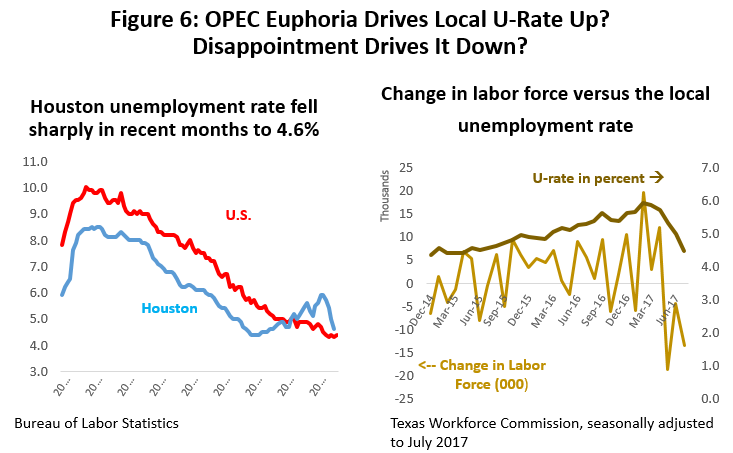
When good news came about oil prices in November, and then better news that some oil-company hiring was underway, many workers again renewed efforts to find a job. Thousands of drop-outs from the labor force were suddenly “unemployed” again, and the right panel of Figure 6 shows that the local labor force expanded rapidly from February to May. The unemployment rate jumped fast and far as these workers flooded into the job market, but it has since dropped back as many of these job seekers were disappointed. Many drop-outs have resumed their stateless status as neither employed nor unemployed, and the unemployment rate has fallen rapidly as the “unemployed” again fall out of the labor force.
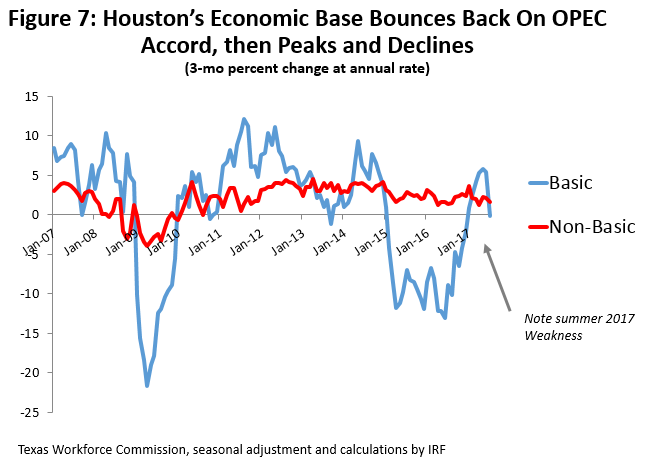
Finally, let’s look at the economic base. Regional economists often divide local employment into two parts. First, the economic base is employment in industries that drive the economy, made up of jobs that export from the region and bring income from the outside. In Houston about half the export-oriented jobs are in the oil industry, and the rest are made up of a wide variety of companies that sell into national markets. Second, the non-basic jobs are inherently local industries that support economic activity – general retail, grocery stores, laundries, dry cleaners, real estate, construction, etc. -- but they follow the growth path set by the economic base.
Figure 7 clearly shows an acceleration of base hiring beginning late last year. In November, base jobs were shrinking at an annualized rate of 4.2 percent, but by June the growth rate was a positive 5.4 percent. This disappears abruptly in July with base growth once more turning slightly negative. Non-basic jobs have continued growing slowly throughout the year despite the gyrations of the base.4
The pattern is quite clear: rapid economic improvement came early in the year, followed by a loss of momentum by spring. This failure of oil markets is a bitter pill, as a sustained turnaround in drilling activity is badly needed to move Houston’s economy off its current sluggish pace. As we approach a third year of modest or no growth, the momentum from 700,000 new jobs created in the boom years is gone, and the petrochemical boom on the Ship Channel is over and rapidly winding down. The U.S. economy still expands at a moderate but healthy pace, supporting the many Houston businesses that sell into national markets. But as we find ourselves on the brink of another reversal in drilling activity, the U.S economy is the one thin reed left supporting the local economy.
Total Employment: Estimates and Revisions
The most timely and detailed data we receive on Houston’s economy is the payroll employment report from the Texas Workforce Commission (TWC). It provides a monthly gauge of the progress of total payroll employment, plus details on a number of specific industries.
The initial monthly reports from the TWC are based on a sample of local businesses and government agencies. As the data from this monthly sample accumulates, more reliable administrative records become available with about a six-month lag.5 TWC stops sampling once a year in early March to do a major benchmark revision based on these records, with a rewrite of economic history that can sometimes extend back as far as 30 months. It then relies exclusively on its sample for the next 12 months.
The Dallas Fed, however, does not wait for the March benchmark, but fills the time lag from March to March by doing its own preliminary revisions as soon as administrative records become available. The switch from sample data to early counts from actual records can sometimes bring big surprises. And an early look at potential revisions is especially important at times like the present, when we are anxiously looking for turning points in the economy. The Dallas Fed employment data for all Texas metropolitan areas, including the preliminary benchmark revisions, can found on their website.6
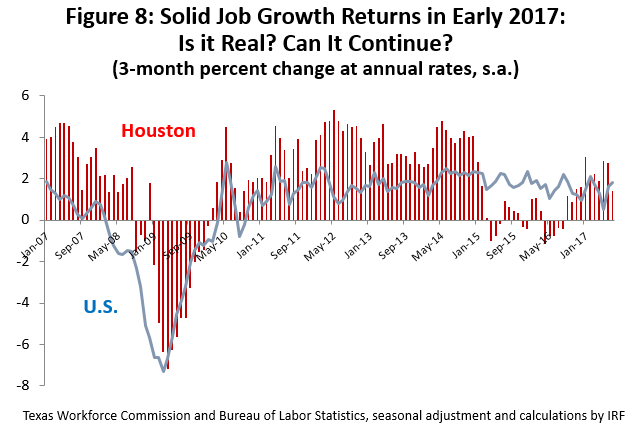
The recent history of job growth in Houston – as reported by TWC -- is found in Figure 8. The strong growth from 2011-2014 demonstrates the power of the fracking boom; it is equally remarkable how quickly employment growth ended after oil prices collapsed in late 2014. The strong growth that resumes in late 2016 is based on sample data left unrevised since last March, or new sample data reported since March. The brief period of OPEC optimism must be mixed into any explanation of this employment surge, but what else accounts for this very strong growth? Is it real, or will it be revised away? Even if real, will it continue?
The current TWC employment estimates show that Houston added 44,900 seasonally adjusted jobs through June of this year, or grew at an annualized rate of 89,800. These are figures that fall just short of those reported during the boom years, and they just seem too good to be true. Job growth slowed in July, and pulled 2017 annualized growth down to 65,800 jobs, but this is still a lot to attribute to a short-lived outbreak of enthusiasm about oil prices.
It is not just the size of these estimates that suggest caution when approaching the numbers, but their history as well. Since the downturn began, payroll estimates have repeatedly run too high, and revisions have continued to bring them down slowly, with the biggest changes often postponed until the second-year of revisions.
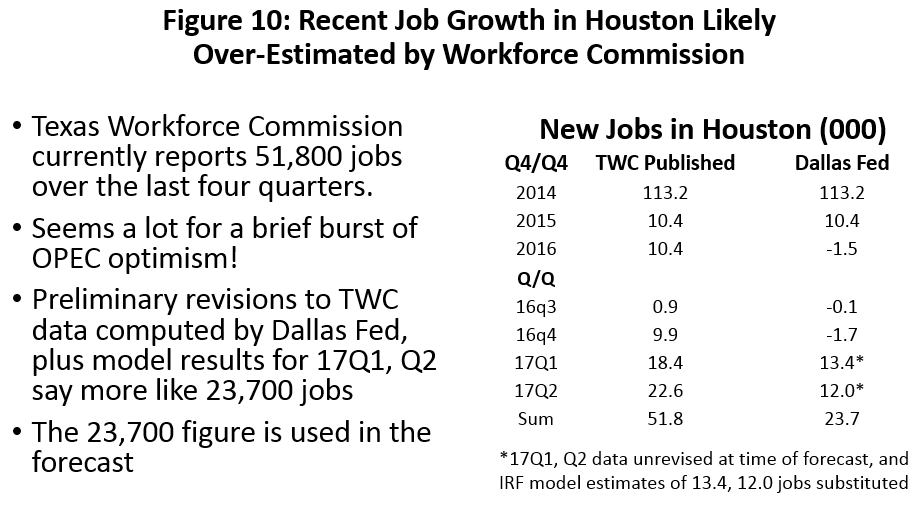
For this specific data, the preliminary TWC estimate for 2016Q4 job growth is currently 9,900 seasonally adjusted jobs; based on new records, the Dallas Fed data has revised this downward to a loss of 1,700 jobs. Employment for all of 2016, a combination of revised and unrevised data, is 10,400 according to the TWC estimates in Figure 8, but the Dallas Fed now has moved it to -1,500. There are many more revisions to come, but the Dallas Fed early revisions strongly suggests we entered 2017 with no forward momentum.
The current estimate of job gains in the oil and gas sector for 2017 is 7,100 jobs, or about 9 percent of the 77,200 jobs that were lost to the oil bust. Most of the returning jobs were in oil services or fabricated metals. We also had 14,400 new jobs in business and professional services, and many of these jobs were probably energy related. Nearly 90 percent of these professional jobs were in the employment services sector, meaning that that they were temporary, and that a final hiring decision was postponed. Given the price of oil today, many of these temporary jobs probably will not become permanent.
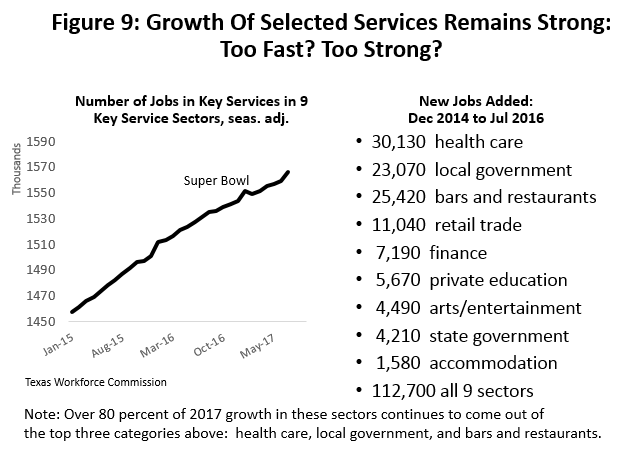
Since late 2014, the nine service sectors listed in Figure 9 have been the major offset to jobs lost in energy. Referring back to our basic/non-basic distinction, these are not jobs that can drive the economy. These are secondary or non-basic sectors stimulated by Houston’s need to catch up with rapid growth from the boom period, from the good times on the city’s east side due to the construction boom, and perhaps by the U.S. economy.
In 2017, over 80 percent of these service-sector jobs have come out of the top three sectors listed in Figure 9. Despite the slowdown in chemical construction, and loss of economic momentum from boom times, these service jobs are still estimated in 2017 to be growing at an annual rate of 2.4 percent, the same as they have grown throughout the downturn. These sectors have had a prominent role in recent over-estimates of job growth, and we can be concerned that these numbers run high.
Where is Houston Headed Now?
There are really two key questions: Where are we now? And where do we go from there? We know that late 2016 job growth was probably over-estimated, leaving 2016 as a year of minor job losses. And that 2017 employment estimates seem high, certainly as a reaction to a short-lived event like the OPEC agreement.
- As we figure this out, let’s accept the Dallas Fed’s 2016 revisions as preliminary but based on real records, and a likely improvement over the TWC sample. This means we sustained job losses in 2016Q4 and for all of 2016 as well.
- The current TWC job growth estimates for the first two quarters of this year seem problematic -- just too high to be credible. For purposes of this forecast, we have assumed that our economic model can forecast the first two quarters of 2017 as well or better than TWC can sample. We accept the TWC’s estimates of oil-related employment as accurate in early 2017. However, we estimate total employment separately. The difference between the TWC estimates and our assumptions for the current employment forecast are shown in Figure 10. For the last four quarters, we have pulled Houston employment growth down from 51,800 to 23,700.7
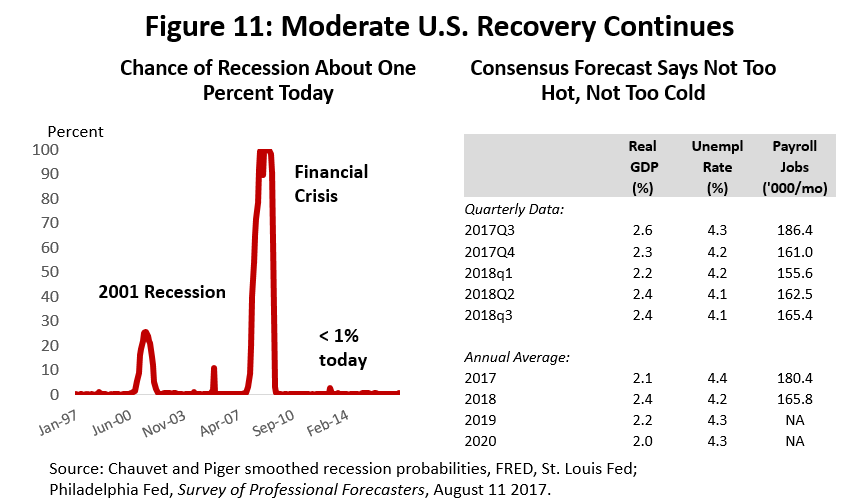
- Going forward, we assume the U.S. economy continues to grow moderately and add jobs at a pace of 150-200,000 per month. As Figure 11 shows, the near-term risk of recession is very low, and the consensus forecast is for moderate but sustained growth. Moving into 2019 and several years beyond, this assumed steady growth becomes a growing risk to the outlook.
- We accept the emerging consensus that the rig count is peaking, and that a moderate setback in drilling is coming soon, a result of the overproduction by the U.S. fracking industry. We use numbers similar to those cited earlier from Raymond James, with the rig count falling to 850 by year end, then growing through 2018 and beyond.
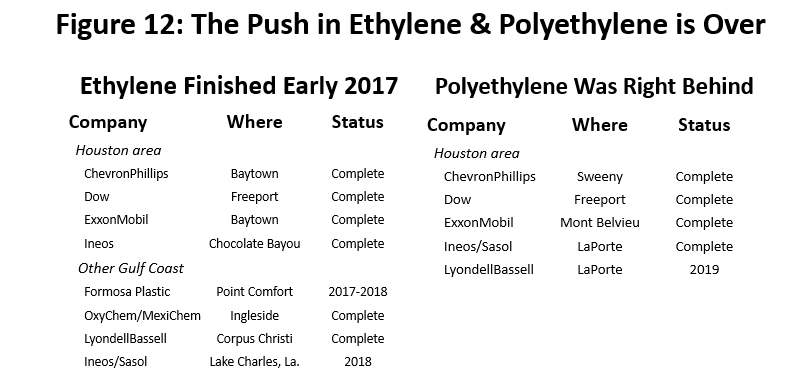
- Our forecast recognizes the end of the petrochemical construction boom on the Ship Channel, and the continued loss of thousands of construction jobs. Figure 12 shows the status of the large ethylene and polyethylene facilities that led the construction boom, and this year most completed all construction phases or started production. More large projects are being announced, but collectively they will not come close to matching the scale of the initial boom or prevent a decline in construction employment.
- The TWC estimate for construction employment in 2017 is a seasonally-adjusted loss of 6,300 jobs. This estimate is not just for lost petrochemical employment, but includes the significant and continuing declines in Houston’s building of new offices, apartments, and industrial real estate projects. The construction sector is another that is difficult to estimate with a small sample.
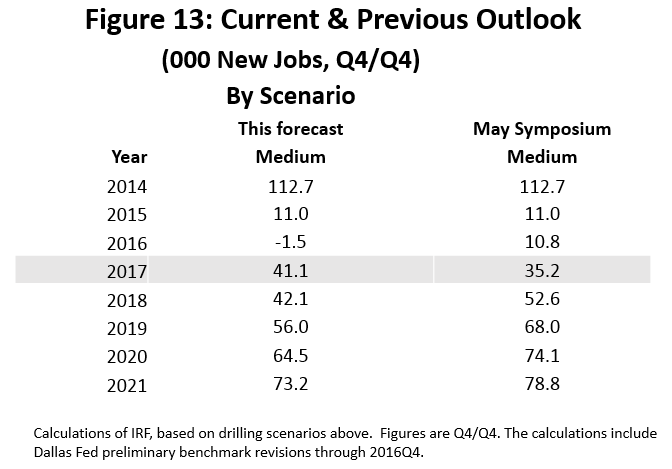
- Using these assumptions, Figure 13 summarizes the job growth forecast by year through 2021. The current forecast is compared to the medium forecast presented at the Symposium last May. The current 2017 forecast is for 41,100 jobs. Once the rig count stalls in the second half of this year, and then picks up slowly next year, the 2018 forecast is flat. We see job growth accelerate in 2019 and beyond.
- As we move into the out-years of the forecast, the outlook becomes weaker than last May. This is partly because of the near-term reversal in the rig count, which delays any restart in the drilling sector by three or more quarters, and puts the entire arc of oil recovery on a later schedule. Further, given the inability of the fracking industry to fall into any disciplined behavior pattern, it is increasingly difficult to be optimistic about a strong and sustained oil recovery.
- Our forecasts that were drawn up before May had more of a bounce in Houston’s economic recovery, with jobs coming back much faster than shown here. Those earlier forecasts assumed that we would see upstream oil jobs return well before chemical construction became a drag on the economy, and before boom-time momentum was lost. It was clear by early this year that the oil bust had dragged on too long for any easy return of local jobs. Much of the oil recovery’s power would be dissipated offsetting losses elsewhere in the economy.
- The good news is that Houston is growing again -- but it is growing slowly. If 60,000 jobs marks an average year in Houston, the economy does not move above these long-term trends until 2020.
Qualifications from Hurricane Harvey?
Losses to Houston’s economy from a large tropical storm like Harvey will be less than widely believed.8 Perhaps the major source of confusion about economic impact is a mix up between the many billions of dollars in property damages, and the measures of continuing economic performance like production, income, and employment. The property damage is sunk cost, forever gone, and means a big write-off on the balance sheet. Although we are collectively poorer as a result, we are still able to work and earn money. In fact, we may earn a lot of overtime in the wake of the storm.
As we move forward, the replacement of lost property generates income, output, and jobs. The burst of activity during this period following the storm will certainly exceed what would have occurred otherwise, and often makes up for the lost worktime and income due to the storm’s disruption.
Second, the lasting damage from Harvey is mostly confined to housing and small businesses like retail, bars and restaurants, dry cleaners, grocery stores, etc. The big pieces of Houston’s economic base – drilling and exploration, Ship Channel industries, medicine, space – sustained relatively little damage, and remain firmly in place to keep the economy moving forward. In these sectors, repairs are mostly a matter of a weeks. Claims of large, sustained losses to local production and income are alarmist, and simply don’t fit the history of these storms on the Texas Gulf Coast.
As we look at the forecast in Figure 13, Harvey should not modify it much, and may even strengthen it some. We may see September employment data look weaker due to disruption from the storm and its immediate aftermath. October and November will offset earlier weakness, as retail sales soar for autos, furniture, carpet, and wallboard, and as reconstruction takes off. Most repairs happen fast, and the bulk of the construction activity probably will be over within a couple of months. Many projects may linger on for much longer, but collectively will not move the needle on an economy of three million workers.
Conclusions
High expectations for rising oil prices were set up by OPEC in late 2016, only to be dashed by overproduction by the U.S. fracking industry. Hopes for a quick return of jobs in Houston’s oil sector were also disappointed by this spring. Despite the an early-year bounce in total payroll employment, pending data revisions now point much smaller job gains than are currently being reported. With the rig count falling, and expected to continue its decline through the rest of the year, Houston’s economic outlook has dimmed again.
With the chemical boom on the Ship Channel over, economic momentum lost from the boom years, and a flat or falling rig count, only the U.S. economy is currently providing broad support for Houston’s economy. It is unlikely we will see a resumption of the large oil and gas job losses we experienced over the last two years, but these jobs also are unlikely to return soon in large numbers. The result is a return of positive job growth in Houston, but at a relatively slow pace. Currently, we don’t expect to see a return to long-term trend rates of employment growth before 2020.
Written by:
Robert W. Gilmer, Ph.D.
Institute for Regional Forecasting
September 11, 2017
Please mark your calendars for our next event – Fall 2017 Economic Symposium on Monday, November 6, 2017, at the Hyatt Regency Hotel, 1200 Louisiana. Registration information will be mailed later this month.
1Much of this section was also published by UH Energy, and can be found on the Forbes website, R.W. Gilmer, “How American Fracking Ran OPEC’s Oil Recovery Off the Rails.” https://www.forbes.com/sites/uhenergy/2017/09/05/how-american-fracking-ran-opecs-oil-recovery-off-the-rails/#602eaccaec26.
2Matt Zboroski, “Downward Trend Continues for U.S. Drilling,” Oil and Gas Journal, August 18, 2017 http://www.ogj.com/articles/2017/08/downward-trend-continues-for-us-drilling.html
3https://www.dallasfed.org/research/econdata/mbci.aspx
4The economic base shown here is identified using a straightforward application of the location quotient methods described in most textbooks on regional economics. Despite the deficiencies of the method, it serves well for the purposes of this example.
5The source of revisions is the Quarterly Census of Employment and Wages, https://www.bls.gov/cew/
6https://www.dallasfed.org/research/econdata/tx-emp.aspx
7On September 6, the Bureau of Labor Statistics released the latest figures from the QCEW, or the main source of future revisions to Houston’s payroll estimates. They gave us our first look at possible revisions in 2017Q1, confirmed that the forecast was effective. The potential revision was to 13,900 from model estimate of 13,400.
8A much longer discussion of Hurricane Harvey and Houston can be found at R.W. Gilmer, “Some Early Thoughts on Houston’s Economy after Harvey,” September 6, 2017, http://www.bauer.uh.edu/centers/irf/houston-updates-sep17-harvey.php