Houston Updates
-
Archive
- June 2025
- March 2025
- December 10, 2024
- September 14, 2024
- May 21, 2024
- March 19, 2024
- December 9, 2023
- June 16, 2023
- April 6, 2023
- March 17, 2023
- Dec. 19, 2022
- Sept. 14, 2022
- July 4, 2022
- March 27, 2022
- March 9, 2022
- September 2021
- April 2021
- March 2021
- September 2020
- August 2020
- June 2020
- April 2020
- March 2020
- January 2020
- December 2018
- June 2018
- March 2018
- February 2018
- January 2018
- September 2017
- September 2017 Post-Hurricane
- June 2017
- March 2017
- January 2017
- September 2016
- March 2016
- December 2015
- September 2015
- June 2015
- March 2015
- December 2014
- June 2014
- March 2014
- November 2013
- September 2013
Houston Economy in 2016: No Recovery in Oil Markets Brings Another Slow Year
December 31, 2015
Over the last 15 months, Houston has seen its economic world turned upside down. Last September, the fracking boom was in full force, the local economy was steadily adding 100,000 jobs per year, and Houston was out-performing the U.S. by a wide margin. Then the price of oil fell, the drilling market collapsed, local job growth turned barely positive, and Houston’s unemployment rate rose above the U.S rate. The latest setback came this summer with the announcement of the Iranian nuclear agreement that will lift trade sanctions and allow Iran’s oil to return to market. Oil prices that had returned to near $60 per barrel last spring were suddenly in full retreat once more. Any hope of a V-shaped recovery in drilling markets was squashed, and along with it any hopes of quick and easy economic recovery for Houston. It means another year of slow local job growth in 2016, with the eventual return of stronger growth highly unpredictable.
Three big events currently drive Houston’s economy: solid U.S. economic expansion, a collapse in drilling that is now unmatched since the 1980s, and an unprecedented petrochemical construction boom based on low natural gas prices. Each of these has its own powerful influence on the local economy, two are positive and one negative, and this article is an effort to sum it all up.
The bottom line for Houston is continued very slow but positive near-term growth, considerable uncertainty about when strong growth will return, and long-term optimism for the future. For Houston, this is not the massive reversal of the 1980s, but one more return to familiar -- if unwelcome – territory. This marks the city’s fifth time though a major drilling bust since 1982. All of them have been painful, but none of them fatal.
Oil Markets Lose Out
A recent editorial in the Oil and Gas Journal reads: “If not for the Iranian increment [of new production] the oil market in 2016 would be headed for long awaited balance.”1 Announced in mid-July, the Iranian nuclear agreement will allow Iran to legally return to world oil markets, to immediately bring new supplies from floating storage, and in coming months to add significant new barrels from renovated oil fields. Opinion on just how much oil the Iranians can deliver and how soon varies widely, but the price of oil fell hard on the heels of the announcement. Over the 60 days before the surprise agreement, U.S. crude price had bounced back to average $57 dollars per barrel, but by late July the price was back under $50 per barrel, and it has stayed well below that level since then.
Oil markets briefly appeared to have grabbed the brass ring this summer, with the prize being the return of higher crude prices. Drilling activity had fallen steeply in early 2010, tumbling faster and further than the 2008-09 downturn, and by mid-July the number of working rigs was only 44.4 percent of the 2014 peak. But higher oil prices in May and June seemed to bring an end to the decline, and even a brief upturn in drilling activity. The upturn lasted only a few weeks, however, ending with the Iranian agreement. Another 150 rigs have been lost since oil prices collapsed once more, the U.S. rig count is now down 63.7 percent from the peak, and we find ourselves mired in the worst setback to U.S. drilling and exploration since the 1980s.
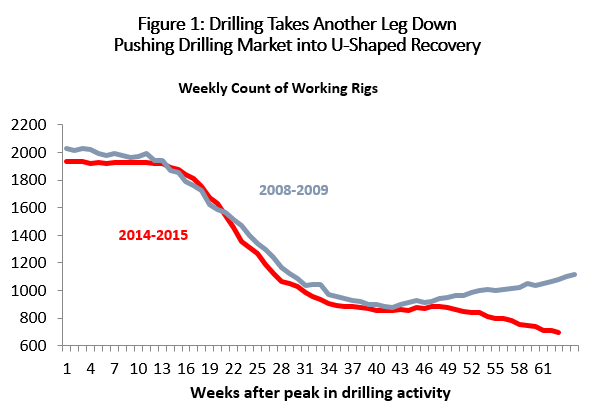
Figure 1 shows the Baker Hughes rig count over the course of the 2008-09 collapse, and compares it to the current decline. We are now 63 weeks into this downturn, with more weeks likely to come. It is not obvious from Figure 1, but the 2008-09 event was a classic V-shaped turnaround. This summer, drilling seemed on the same schedule as 2008-09, bottoming out around week 40. But then the recovery was aborted in July, and this will be a deeper and delayed U-shaped recovery.
When the brass ring was snatched from world oil markets, it was a significant loss for Houston’s economy as well. As soon as oil prices stabilized in the spring, local oil-related layoffs slowed, payroll employment briefly turned around, and most economic indicators showed that Houston’s economy had found some positive footing. A V-shaped recovery in oil prices and drilling activity would have brought a V-shaped recovery for Houston’s economy as well. This quick turnaround would have been the best possible outcome for Houston, and it was the most likely outcome until the Iranian deal was announced. Now Houston faces the fallout from sustained low oil prices and a very deep downturn in drilling.
The Houston Economy Now
Three big events currently shape the outlook for Houston. First, Houston benefits from a strong U.S. economy that supports many jobs throughout the metropolitan area. Local companies that reach into national markets such as HP, BMC Software, United Airlines, AIG, and Sysco benefit from national strength. After eight years of recession and sluggish recovery, the US economy finally appears to have put the Great Recession behind it. We assume throughout this discussion that US payroll employment grows at 1.7 percent per year, adding an average of 200,000 new jobs per month.
The most important single factor currently shaping Houston’s economy is the collapse of oil prices and drilling. Once the payroll employment data for Houston are revised in March, they are likely to show that 2015 brought the loss of over 30,000 jobs in oil and gas production, oil services, and oil-related manufacturing. The timing and pace of any drilling recovery is uncertain, and we will look at three scenarios to see how this oil downturn might play out. However, the V-shaped recovery that was the best and most likely option last summer is now off the table. Houston will see no quick and easy return to strong job growth.
Finally, the third factor driving the local economy – and most surprising – is a major boom in building downstream petrochemical, refining and liquefied natural gas (LNG) plants. Primarily driven by low natural gas prices, over $50 billion in oil-industry construction is underway in east Houston, bringing an influx of skilled construction workers. These are temporary workers, and the plants will leave relatively few jobs in their wake once completed, but this construction could not be better timed as a counter to mounting layoffs from the drilling collapse.2
Pulling the three events together, the result is likely to be very slow job growth in 2015 and 2016. At the spring Symposium, the IRF forecast for 2015 employment called for 13,000 new jobs in Houston3, and the Texas Workforce Commission says that after 11 months we are on track for 17,300. The Dallas Fed does early and preliminary revisions to the payroll employment data, and their calculations indicate that Houston is perhaps on track for 4,000 new jobs. All sources agree that the number of new jobs is small but positive, and down substantially from the 100,000 new jobs per year that Houston added each year from 2012-2014. But no recession is yet underway, and Houston is certainly not experiencing a recession anything like the 1980s, where the metro area lost 13.3 percent of its jobs, or better than one in eight.
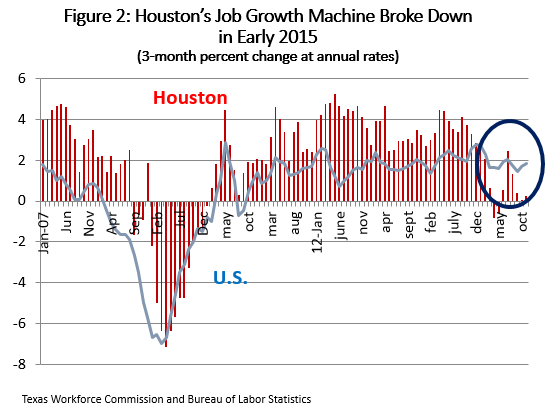
Figure 2 shows the recent history of payroll employment growth in Houston. Local job growth resumed after the Great Recession at about the same time and same rate as the U.S. However, while the US struggled in the recovery, Houston accelerated as the fracking boom set Houston’s job market apart from the rest of the country. Also note how quickly job growth came to a halt in early 2015, as soon as the price of oil fell. With oil price returning to the $50-$60 range at mid-year, Houston briefly began to add jobs again, but growth once more evaporated after the Iran nuclear accord was struck.
Three Scenarios
Looking forward, we assume the US economy performs well, and that downstream construction adds to local jobs throughout 2016. The determining factor in Houston’s economic outlook becomes the level and timing of improvement in oil prices, leading to more spending for exploration and production, and in the number of working rigs.
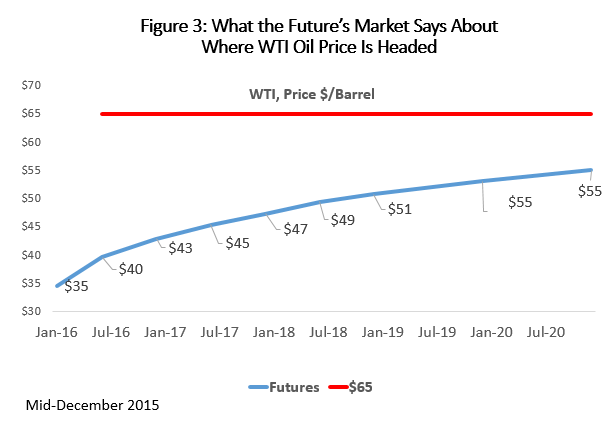
We propose three scenarios for how a drilling recovery might unfold. Why scenarios? The current range of opinion on how fast and how far oil prices will rebound is very wide, ranging from a rebalancing of the market in mid-2016 to prices below $60 through 2021. Figure 4, for example, tracks the NYMEX futures prices for West Texas Intermediate through 2020. If $65 per barrel is taken as the level needed to see a healthy revival in drilling and fracking activity, this is a disappointing outcome that points to a prolonged and difficult oil slump.
In principle, the futures market brings together all the information available about the outlook for oil prices, and should be the best possible forecasting machine. If anyone has significant new data to add to the oil price forecast, they should trade on that information, and incorporate their news into the outlook. Unfortunately, most studies of the market’s forecasting performance say it has a lackluster track record at best.4 A number of studies would agree its forecasts probably incorporate everything publicly known about future oil prices. It generally provides unbiased forecasts that are not systematically high or low. While it is not very accurate, it turns out to perform as well or better than most subjective forecasts or standard statistical tools. Its poor performance is not the result of our ignorance about the past and how the past might affect the future, but more about the all the things that are unknown and will affect the future.5 The futures prices as a forecast get worse the further we try to move into the future, particularly after about six months, but this is true of other forecasting techniques as well. We are simply can’t even guess at the key economic and political factors that will move oil markets over the coming 3, 6, 12, 24 or 36 months. Our view of the world will change several times before we get far into the future.
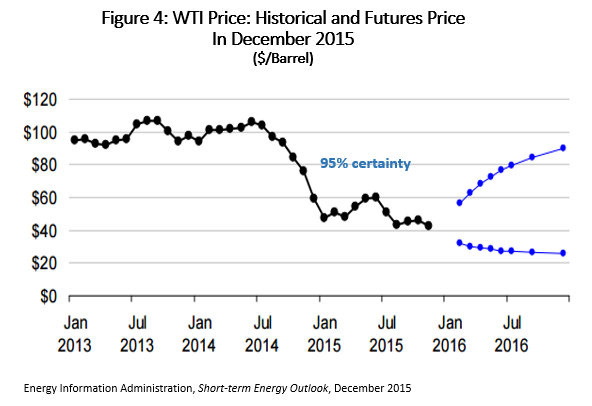
We probably won’t do much better than the oil-price forecast delivered by the futures market, but how accurate is it? The Energy Information Administration regularly computes error bounds for the futures market estimates of the price West Texas Intermediate.6 They look at historic implied volatility in the futures market, solve the Fischer Black option pricing model, invert the model, and compute error bounds on the market forecast of future prices. The results are shown Figure 5. On the one hand, the market provides a point estimate of $35 per barrel for December 2016. But if we ask for a range that is 95% certain to contain the realized price next December, the information currently in the future’s market means the price of oil should be somewhere between $24 and $95 per barrel. At 66 percent certainty (a little better than a coin flip) we would still be left with a range of about $40 to $80 per barrel.7 This is not very useful. At the high end, $80 or $95 oil would imply a year of very robust recovery for Houston’s economy, and at the low end it means another year of debilitating economic weakness.
Given this ignorance about future oil prices, we would be better off considering a range of outcomes for oil price, and then figuring out what these prices mean for oil-field activity, the local economy, and – ultimately – for economic growth. Planning then can deal with a range of outcomes rather than a single, highly-suspect price or price path.
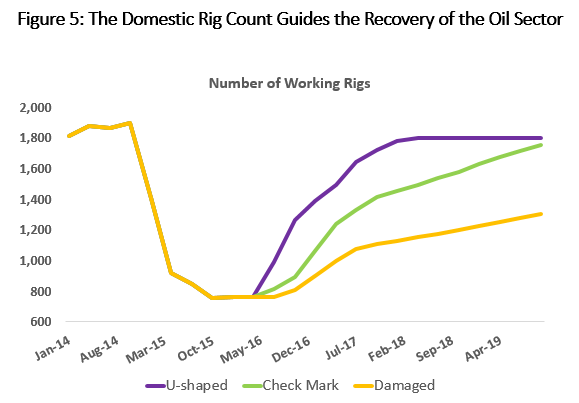
Our three scenarios are based explicitly on the Baker Hughes rig count and the return of drilling.8 The rig count is assumed to be nearing a bottom that is similar for all scenarios, and the chief difference among them is the timing and strength of the drilling upturn.
- In the past, we used a V-shaped recovery that begins in early 2016, with drilling and the rig count expanding as fast as in the recovery of 2009-2010. This scenario died when the Iranian nuclear agreement was announced.
- A U-shaped recovery, similar to the V shape, except now delayed until mid-2016. The rig count returns to 1800 rigs, and recovery – once it begins – is at the same pace as the 2008-09 drilling recovery. Once recovery is complete, energy jobs in Houston grow at 1.8 percent annually, a rate typical of the early phases of the fracking boom. This takes the same role that the V-shape played in the past – a strong recovery of energy employment taking place two or three quarters in the future.
- A Checkmark recovery, with the rig count flat through 2016, and then growing relatively slowly through 2020. The rig count returns to levels near 1800 only by late 2019. Energy jobs return cyclically and with the rig count, and they return to 2014 levels only in 2019Q4
- Fracking is damaged seriously by sustained low oil prices, the rig count is only 1300 by the end of 2019, and energy employment never returns to levels near 2014 over the forecast horizon
Figure 5 shows the rig count assumptions for the three scenarios.9 There is a strong statistical tie between the rig count and short-term movements in local energy employment, and the tie has strengthened since the advent of fracking.10 Over the long-run – once the cycle ends and we move into a new expansion of local energy employment – statistical models can provide no guidance. I assume that long-run energy employment grows at about a 1.8 percent annual rate, a number that is quite conservative compared to the latter stages of the fracking boom. It should reflect a healthy fracking industry, but without the frenzy of recent years.
If this drilling bust was the only major energy event in Houston, even with the US economy growing strongly, it would mean a moderate local recession. As the oil downturn lengthens from prior forecasts, the job losses from this hypothetical Houston recession range from 81,000 over 7 quarters for the U-Shaped event, to 99,100 over 9 quarters for the “fracking damaged” scenario. While job losses in these scenarios are not as fast or deep as the losses in the 2008-09 downturn in Houston -- when 100,000 jobs were quickly lost, and then just as quickly restored -- as the Fracking Bust extends through seven or more quarters, it ultimately pushes job losses closer to the 100,000 mark.
But there is another major energy-related event under way in Houston, one that can prevent this hypothetical recession by bringing $50 billion in new construction to the industrial east side of town. We have explained the origins of this downstream construction boom at length elsewhere, but it is built primarily on low natural gas prices.11 Ethylene, for example, is a petrochemical intermediary that is a major building block for plastics such as polyethylene and polyvinyl chloride. In North America it is made from the natural gas liquid ethane, which is priced much like natural gas, or at the energy equivalent of $20-$25 per barrel of oil. The rest of the world primarily uses oil-based naphtha to make ethylene, meaning that feedstock until recently was priced at $100 per barrel. This difference between feedstock prices in North America and the rest of the world kick-started an enormous expansion of Gulf Coast petrochemical plants, accounting for $32.7 billion in new construction in the Houston metro area alone. More construction is spread up and down the Gulf Coast.
A second major source of local construction – about $6.7 billion -- is the liquefaction of natural gas for export. Like petrochemicals, it is low domestic natural gas prices that make these LNG export facilities economically attractive. A major plant at Freeport is the only project in the Houston metropolitan area, but a series of other plants are under construction in Corpus Christi, Sabine Pass, and near Lake Charles. There is concern that so many plants are under construction or proposed that there could be a glut of LNG by the end of the decade. However, the regional plants mostly have take or pay contracts that give them a high probability of completion.
Finally, a number of refinery projects have joined the parade of new plants and plant expansions. Low oil prices have increased refining margins and profits, and $4.7 billion in construction has been announced. Add another $3.4 billion for new natural gas processing plants to separate natural gas liquids from methane.
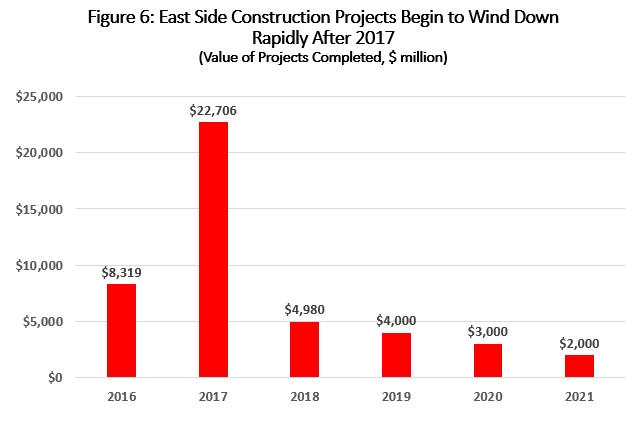
These construction jobs are an important offset to losses from the drilling bust, and another 10,000 workers may be hired in east Houston in 2016. They are temporary jobs, many workers are drawn to the area for short-term work, and their impact on new home construction, office space, high-end retail, and luxury apartments will be quite limited. Figure 7 shows that construction will wind down quickly beginning in 2017. The new plants will offer good jobs after they are completed, but they will be small in number compared to the thousands of workers required to build them.
Employment Forecast
Table 1 summarizes the recent history of the Houston business cycle. It includes five periods containing the largest declines in domestic drilling activity in modern history, beginning with the 1980s. The 1980s oil bust was kicked off by the short but serious 1981-82 U.S. recession, but in Houston the downturn assumed a life of its own with an 82 percent fall in drilling. Oil problems were compounded by massive, not-to-repeated excesses in real estate and banking, and it turned into five years of deep local recession. The Asian Financial Crisis brought $10 oil and a 46.0% fall in drilling, but there was no local recession thanks to very strong U.S. growth. During 2001-03, Houston saw a shallow but long recession, responding to a mild national downturn, a 35.4 percent fall in drilling activity, and the fall of Enron. This is the only past Houston recession where strong petrochemical construction was a positive mitigating factor. In 2008-09, everything went wrong with a very deep U.S. recession, drilling falling 50.9 percent, and no help from the downstream.
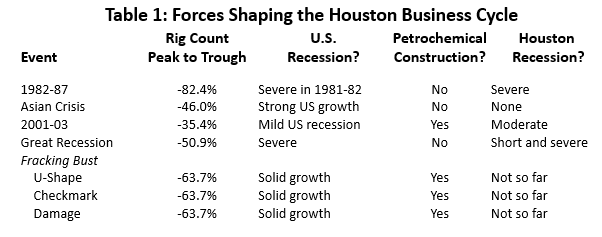
If we add petrochemical construction into the forecast, treating construction workers as a temporary injection of energy employment in Houston, it is just enough to keep the Houston economy out of recession. Figure 7 shows how payroll employment in Houston behaved through the cyclical events described above, as well as in the forecast scenarios. The Asian Financial Crisis and 2001-03 are the periods that most resemble Houston’s response to the current downturn. In the Asian Financial Crisis very strong U.S. growth prevented a Houston downturn despite a significant drilling decline. In 2001-03, Houston saw mild recession followed by a long period of slow growth. Now, moderate US growth and substantial help from downstream construction are working to offset the worst drilling downturn since the 1980s.
All three scenarios for the current Fracking Bust have similar assumptions. This is the worst drilling downturn since the 1980s, the U.S. economy is strong, and the petrochemical construction is unprecedented in scale. The difference in the scenarios is in the timing of the recovery, and the pace at which rigs return to service once recovery is underway.
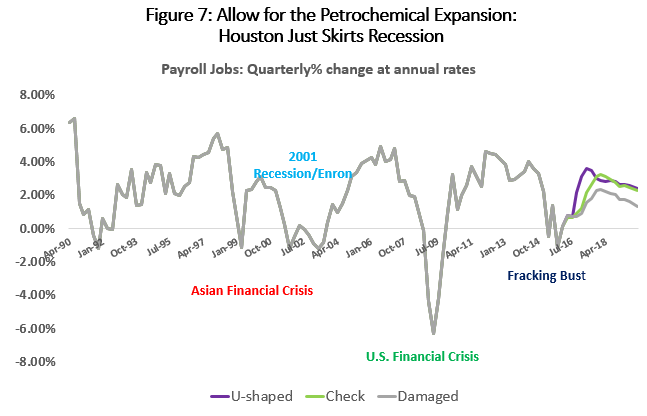
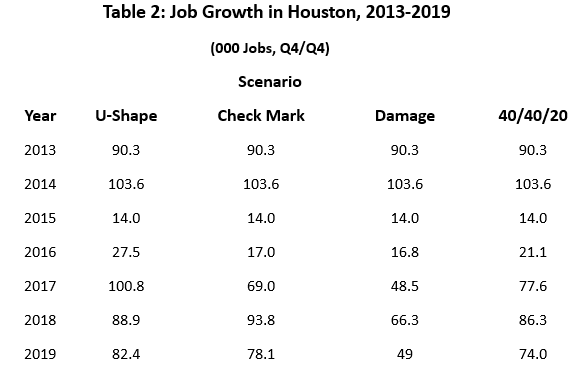
Table 1 shows the forecast payroll employment numbers. The U-shaped recovery begins in the third quarter of 2016, and assumes that the fracking boom is quickly resumed. The bubble-like conditions of 2012 to 2014 are missing, but fracking returns as a solid and growing part of American oil production. The Checkmark recovery picks up steam in 2017 and accelerates into 2018. Since 1990, payroll employment in Houston has grown at a 2.2 percent annual rate, and the “fracking damaged” scenario touches this long-term trend rate only in 2018. Otherwise, its forecast of job growth is well below historical expectations.
The 40/40/20 column is a probability-weighted forecast that assumes a 40 percent chance that either the U-Shape or Checkmark scenario is the right outcome, but only a 20 probability for Fracking Damaged. This can be treated as “most likely” outcome at present. This forecast sees a slow 2016, followed by above trend growth in 2017 and 2018 as the energy market recovers. Over the long-term, as cyclical events work their way out of the forecast, job growth should average near 65 – 70,000 jobs per year.
Another Slow Year In 2016
Having lost the opportunity for a quick recovery, all the employment scenarios for Houston point to another slow year in 2016. So far, much of the economic damage from low oil prices is confined to oil production, oil services, and oil-related manufacturing. As the rig count bottoms out in 2016, oil-related layoffs should slow sharply. However, additional time without a real turnaround in oil markets provides the opportunity for economic damage to spread through many sectors that have yet to feel much pain.
Many businesses in Houston will tell you that they have yet to see much effect of the drilling bust. Strong job growth continues unabated in sectors such as education, healthcare, leisure, hospitality, and local government. Sales and price levels are holding up for single-family housing. Apartment occupancy and rents are still strong. Retail sales are still growing, and restaurants are still crowded.
Some of this activity stems from Houston’s current economic strengths: US economic growth and petrochemical expansion. Some activity is the result of past momentum. Houston added nearly 680,000 payroll jobs between 2003 and 2014, the equivalent of a metro area the size of Oklahoma City. Even as job growth slowed in 2015, there remained serious demand for housing, shopping centers, bars and restaurants, schools, roads, and other infrastructure. But the catch-up phase will lose momentum as slow growth extends into 2016.
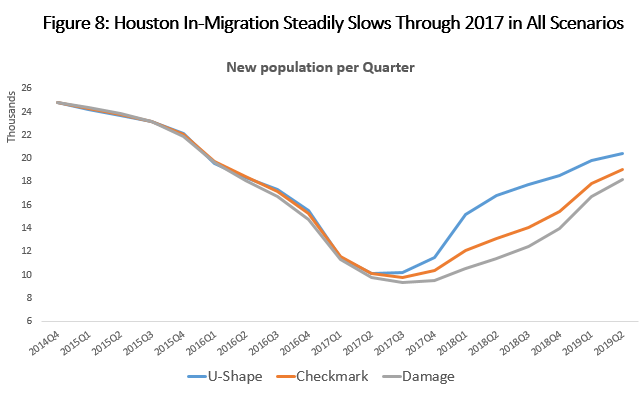
Finally, 2015 population growth probably remained at very high levels, as in-migration typically continues for several quarters after job growth slows. But with a second year of poor job growth, news will spread that that Houston is no longer a growth mecca for the nation’s unemployed. Figure 8 shows the how the slowdown of in-migration might work in our three scenarios. In no case does it begin to accelerate again before the second half of 2017.
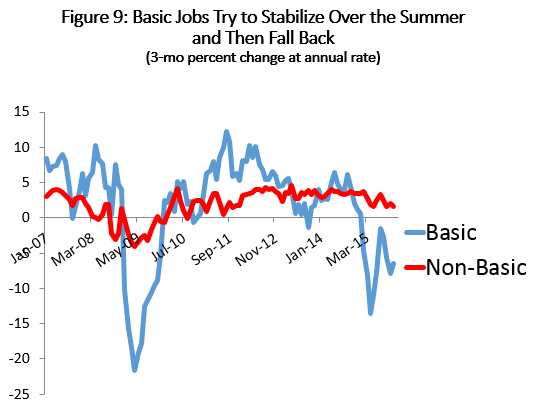
Regional economists often distinguish basic and non-basic industries. Basic industries export from the region, and bring Houston income and revenue from the rest of the state, the rest of the nation or from abroad. They are drivers of local economic growth. Examples in Houston can be energy industries like oil producers, oil services, pipelines, refiners or chemicals. High concentrations of local employment in wholesale trade, airlines, and professional and business services indicate that large parts of these Houston industries are also exporters of basic services. These industries drive local growth, but are highly susceptible to external factors like oil prices or the national business cycle. Figure 8, shows the rate of growth in employment in base industries in Houston, and the cyclicality is apparent. Annualized growth rates in Houston since 2007 have ranged from 12.2 to -21.6 percent.
The non-basic part of the economy is the economic follower, the inherently local industries that expand to serve the growth delivered by the base industries. Examples are dry cleaners, laundries, car washes, grocery stores, drug stores, retailers, most construction, and real estate. They deliver absolutely indispensable services to the local economy, but these followers depend on other sectors to deliver the growth that justifies their existence. Figure 8 shows that non-basic growth is much more stable, accelerating to near five percent per year in the recent fracking boom, but slowly losing steam over the past year. It is these non-basic jobs that have been carried by past momentum and now-waning population growth. Another way to state our earlier observation about 2016 is that the big blow from drilling has been to the economic base, but the coming year will see the non-basic part of the economy continue to slow and share the pain.
A recent study from Rice University can provide one more perspective on what another year of slow growth means for an oil center like Houston.12 As we put a drilling rig to work, we immediately create 37 jobs, but over the long-run we create 224. In other words, additional jobs are added as we work our way back through the supply chain to company management, engineering, R&D, legal, personnel, accounting, through various contractors and suppliers, and ultimately to employees that spend oil-related paychecks at the local Wal-Mart, Kroger’s and CVS Pharmacy. This works in reverse as well, and the loss of 1,222 working rigs has now put in train the loss of 274,000 jobs – with an oil center like Houston a significant target for potential cuts. It takes time for these layoffs to unfold and work all the way back to Kroger’s or CVS, but now we have another year for the losses in oil and gas to spread much more widely. In 2016, many of the local non-oil businesses that have felt bulletproof to this point will realize how much they depend on the oil industry to sustain healthy growth.
Time to Think About Diversification?
No, it is not time to think about diversification. Houston is America’s oil headquarters, and a global center for drilling technology and oil services.13 For Houston, oil means top-of-the-line white-collar employment – executives, engineers, geologists, and geophysicists. Does San Jose want to give up tech? Detroit abandon the automobile? Wall Street quit doing finance? I don’t think so, although in each case a highly cyclical industry has made their local economies highly cyclical.
Houston is justifiably famous for losing 225,000 jobs or 13.3 percent of its payroll employment between 1982 and 1987. The lost jobs were restored, however, by early 1990. But compare San Jose, which from 2001 to 2004 lost 211,000 jobs or 19.7 percent of its payroll employment. Over the coming few months -- 14 years later -- San Jose should finally return to its December 2001 peak employment level. Curiously, every city looking for diversifications wants to be a tech center.
Let’s look at the growth of personal income in Houston since 1969, and compare it to the other 20 largest metro areas in the U.S. This is a period that includes all of Houston’s major oil reversals, including the devastation of the 1980s. Over the last 45 years, measured by the growth of income, Houston is the second most successful large metro area in the U.S., just behind Phoenix. Houston has grown 1.8 percent per year faster than the typical U.S. metro for 45 years.
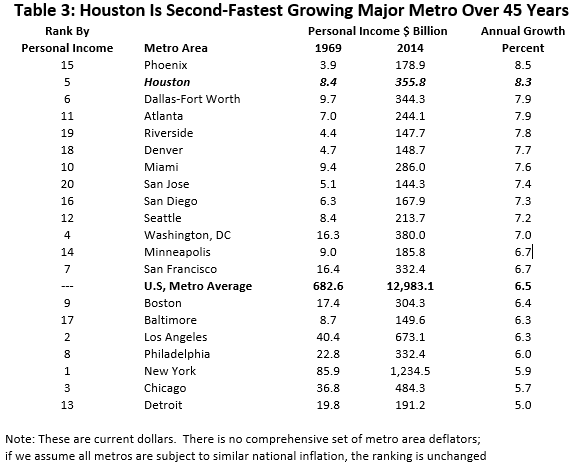
Is it just choosing large metros that makes this work? Going down the list of metros ranked by total 2014 personal income, the smaller metros that have grown faster than Houston are not unexpected: Austin at #32 (9.5% per year), Orlando at #35 (8.5%), Las Vegas #37 (9.3%), Raleigh #45 (8.9%), and then falling down the list to Fort Meyers at #78 (9.7%). This is good company in terms of fast-growing and successful economies, although none are quite in the same league yet as Houston in terms of size.
Oil may have taken Houston on a long and bumpy ride since 1969, but it also has been a high-flying and successful venture. Maybe we should think twice about seeking diversification and tinkering with the current growth formula. Houstonians love living with success, but probably need to do a better job of preparing themselves for the numerous temporary setbacks that come with the current oil-laden industry mix. Maybe rule one should be to better understand the pitfalls – and never bet your business on the price of oil.
Notes
1 The Kingdom in Control, Oil and Gas Journal, December 14, 2015, p. 15
2 R.W. Gilmer, "Upstream Bust Meets Downstream Boom in Houston: The East Side Earns Some respect," December, 2015, Forbes blog post at http://www.forbes.com/sites/uhenergy/2015/12/01/upstream-bust-meets-downstream-boom-in-houston-the-east-side-earns-some-respect/
3 R.W. Gilmer, Houston Outlook Grows Darker as Oil Downturn Turns Deeper and Longer, June 2015, http://www.bauer.uh.edu/centers/irf/houston-updates-june15.php
4 William G. Tomek, "Commodity Futures Prices as Forecasts," Review of Agricultural Economics, 19, #1 (Spring-Summer, 1997), pp. 23-44.
5 Suppose in a global and complex system like the oil market, we can think of a 1000 very low probability events that could throw an oil price forecast off track over the next six months. None of them has a probability above one-tenth of one percent, and would never be incorporated in any forecast. However, the probability at least one of these events occurs is 1 – (.999)1000 = .632. In other words, before 6 months is up, there is a 63.2 percent chance that our forecast will be disrupted by at least one of these highly unlikely events. At the time the forecast is drawn up everything important is incorporated, but the unforeseen and unpredictable intervenes more often than not.
6 Bob Ryan and Tancred Litterdale, "Energy Price Volatility and Forecast Uncertainty," October 2009 at http://www.eia.gov/forecasts/steo/special/pdf/2009_sp_05.pdf
7 Energy Information Administration, Short-term Energy Outlook, "Market Prices and Uncertainty Report," December 8, 2015 at http://www.eia.gov/forecasts/steo/uncertainty/
8 Looking back through 45 years of domestic drilling activity, the key driver for activity has alternated between oil and natural gas prices. Right now, oil is critical. In the early stages of fracking, it was the price of natural gas that mattered. In either case, it comes back to how many drilling projects are underway, how much management and engineering is required, and how many crews are in the field. The number of working rigs brings us a step closer to Houston employment than either oil or gas prices alone.
9 The forecast presented here are much like those presented at the IRF Fall Symposium in November. Differences arise from the fact that we can now completely discount any V-shaped recovery, from the rig count having dropped to near 700 working rigs, and from the shape of these curves describing the recovery of the rig count.
10 Prior to 2003, a one percent increase in the rig count would increase Houston’s energy employment by 0.08 percent over the next two quarters. After 2003, the same increase in the rig count meant an increase in energy jobs of 0.11 percent, or 22 percent more. Presumably this reflects the much more capital-intensive nature of fracking, and the need for more engineering than a typical vertical well. The vertical well might be less than a million dollars, while horizontal drilling and fracturing might cost $6-$8 million.
11 See references in notes 2 and 3 above.
12 Mark Agerton, Peter Hartley, Kenneth Medlock III and Ted Temzelides, "Employment Impacts of Upstream Oil and Gas Investment in the United States," IMF Working Paper/15/28 (February, 2015) at https://www.imf.org/external/pubs/ft/wp/2015/wp1528.pdf
13 R.W. Gilmer, "Houston: America’s Oil Headquarters," Tierra Grande, Texas A&M Real Estate Center, Publication 20151 (January, 2014), at https://assets.recenter.tamu.edu/documents/articles/2051.pdf
Written by:
Robert W. Gilmer, Ph.D.
Institute for Regional Forecasting
December 31, 2015