Houston Updates
-
Archive
- June 2025
- March 2025
- December 10, 2024
- September 14, 2024
- May 21, 2024
- March 19, 2024
- December 9, 2023
- June 16, 2023
- April 6, 2023
- March 17, 2023
- Dec. 19, 2022
- Sept. 14, 2022
- July 4, 2022
- March 27, 2022
- March 9, 2022
- September 2021
- April 2021
- March 2021
- September 2020
- August 2020
- June 2020
- April 2020
- March 2020
- January 2020
- December 2018
- June 2018
- March 2018
- February 2018
- January 2018
- September 2017
- September 2017 Post-Hurricane
- June 2017
- March 2017
- January 2017
- September 2016
- March 2016
- December 2015
- September 2015
- June 2015
- March 2015
- December 2014
- June 2014
- March 2014
- November 2013
- September 2013
Is the Oil Bust Over? And What Does it Mean for Houston?
June 3, 2017
Tell me the course of oil prices in coming months, and I can tell you a lot about Houston’s economic performance. Houston’s economy is inextricably tied to oil markets, and the price of oil remains an important ingredient of its business cycle. But forecasting crude oil prices is difficult — if not impossible. As the current drilling collapse has slogged on through two long years, it has delivered repeated lessons in humility for forecasters of all stripes. The initial 2014 oil price decline was almost completely unanticipated, for example, and then a tentative recovery in the summer of 2015 was unexpectedly aborted by the return of Iranian oil to market.
Now we find ourselves at yet another turning point. In November 2016, a wave of welcome optimism entered oil markets, largely based on an OPEC agreement to restrict production. Several official forecasts by U.S. and international agencies indicated that a rebalancing of oil markets was well underway or had happened already, and it generated strong positive sentiment in the futures market. The OPEC agreement was simply meant to accelerate a rebalancing that was already thought to be falling together quickly. The classic green shoots of an oil market recovery blossomed as the futures prices rose, the rig count grew rapidly, and recovery even extended to Houston’s job market.
Just in the last few weeks, however, this oil market optimism evaporated as WTI price once more slipped back to near $48 per barrel. OPEC is again trying to revive expectations by extending its production cuts, but oil prices still hover below $50 per barrel. Is this a brief setback on the road to higher oil prices? Or could the latest price reversal kill those green shoots before a drilling recovery is well rooted.
It Is Still About Oil Prices
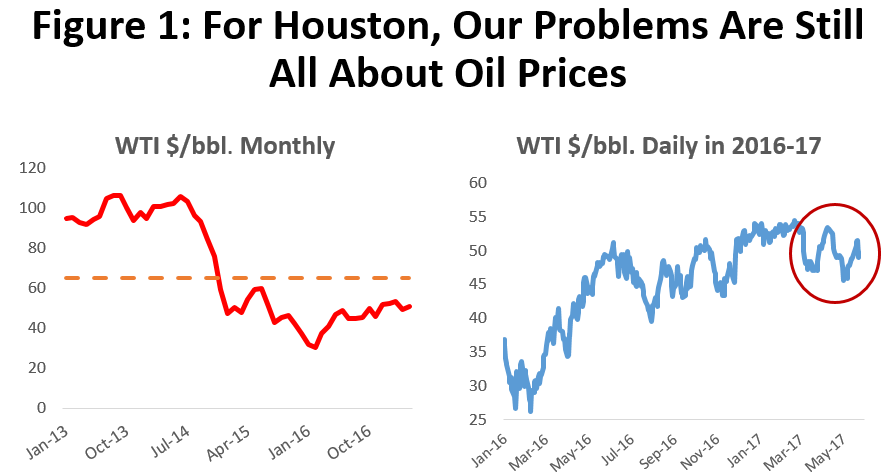
What happened to oil prices this time? After falling as low as $26 per barrel in February 2016, oil prices had moved back to $53 per barrel through the first two months of this year, and – importantly – it was expected that they would continue moving higher. The oil price recovery came in two steps: (1) an initial bounce back to $45 last spring after a deep collapse in drilling, and (2) further increases based on the late-2016 possibility of a near-term rebalancing of oil markets. Price jumped to more than $50 per barrel last November, as OPEC cut production to absorb excess supplies and speed price recovery. In anticipation of sustained price increases through the spring, speculators piled into record levels of bullish long positions in the crude oil futures markets. (Figure 1.)
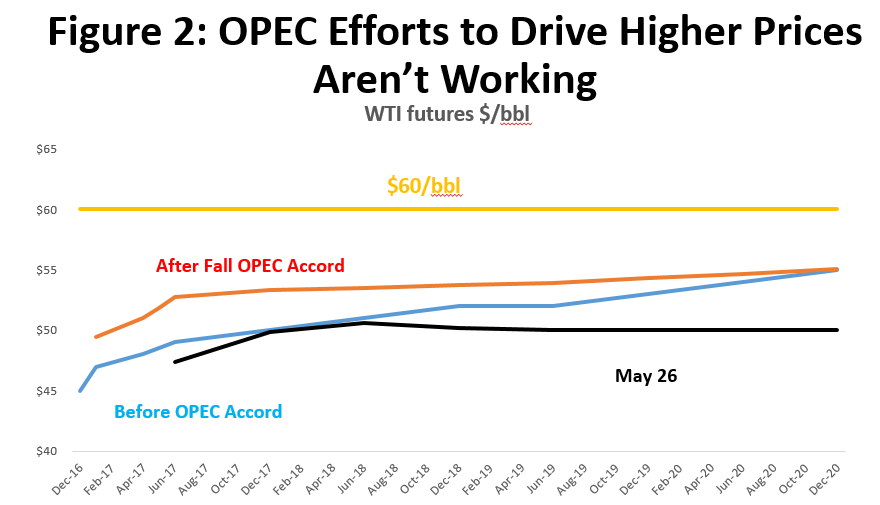
But impatience mounted after oil price gains stalled in the spring, and a brief build in U.S. oil inventories and a few negative comments from the Saudi oil minister quickly pushed prices back under $50 in March. Figure 2 shows the forward futures curve for crude oil prices, comparing futures before the OPEC agreement last November, after the agreement in February, and then on May 26. All of the heightened expectations built into oil markets by the OPEC accord had dissipated. Price expectations now sit near $50 throughout the coming months and years. These expectations can – and often do – change quickly. But is the next change for better or worse?
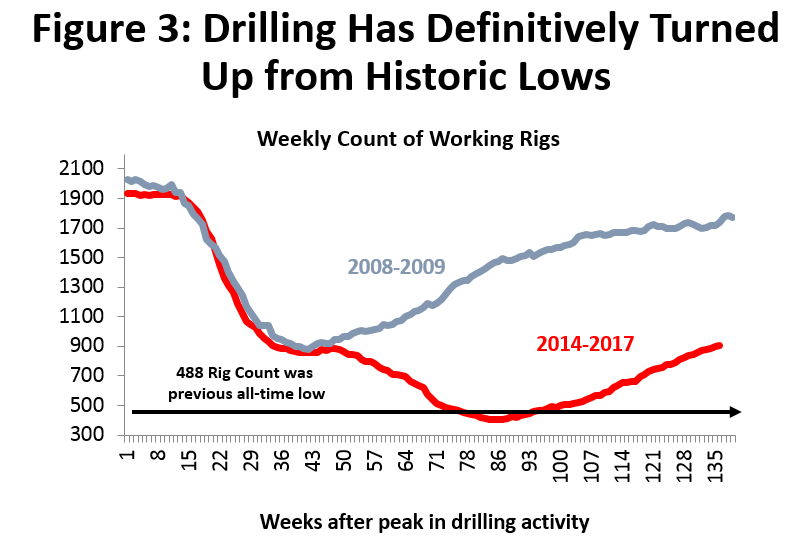
The initial rebound in oil prices in 2016 generated real optimism among U.S. oil producers and oil service companies. The big three oil service companies – Schlumberger, Halliburton, and Baker Hughes – all quickly declared that the trough of the price cycle had been passed, and that a drilling recovery was underway. Oil producers responded to better oil prices by funding a burst of drilling activity that more than doubled the rig count, bringing it from the trough at 404 rigs to over 900 by late May. (Figure 3) U.S. oil production peaked in July of 2015 as oil-directed drilling collapsed, fell by about 750,000 barrels per day, but is now rising again in response to increased drilling. Drilling that has already taken place this year is expected to push U.S. production up by a million barrels per day by year-end, all but guaranteeing a return to record levels of U.S. oil production.
Is Robust Recovery Underway?
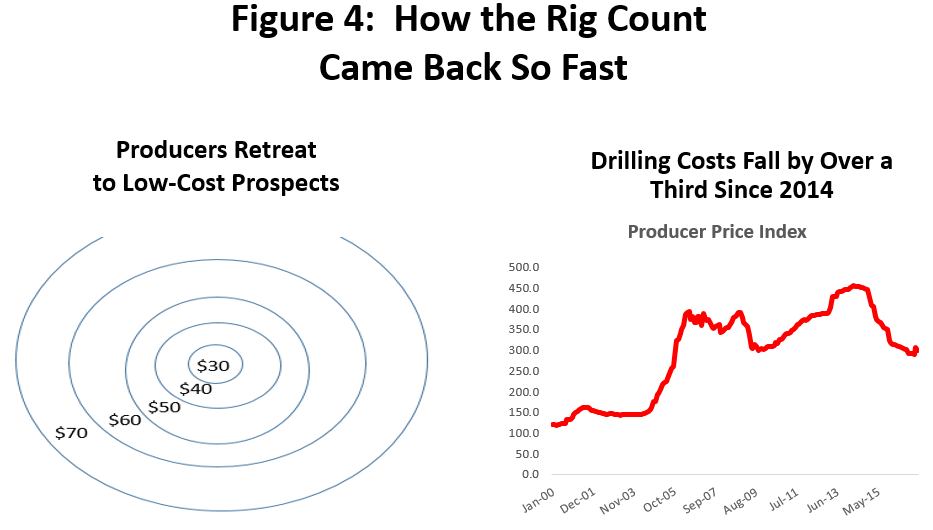
We have seen the worst of this oil downturn, but current oil market outlook remains – at best – a glass half full. There was a rapid rebound in drilling, but the 900 rigs at work are still far short of the 2014 peak of 1,931 rigs. This also has been the fastest start to a recovery in drilling that we have ever experienced. Why so fast? It was partly because the price of oil – and the level of drilling activity – fell so fast and so far. As the price of oil fell, oil producers were forced to retreat to their very best, low-cost properties, where oil could be produced for $30 per barrel or less. (See Figure 4). This low-cost exploration and production was helped by falling oil service costs, as reduced drilling activity cut the rates and fees that service companies could charge. For the service company, any price became attractive as long as it could cover short-run operating costs, keep staff and crews working, and perhaps recover some capital. Since 2014, oil services costs have fallen by 40 percent.
As oil prices begin to rise, producers quickly and easily move back to their higher-cost wells, producing once more at $40, then $50, etc. The cost of production rises along with the move out of the sweetest spots in the oil field, and as service companies seek higher rates to again recover capital costs.
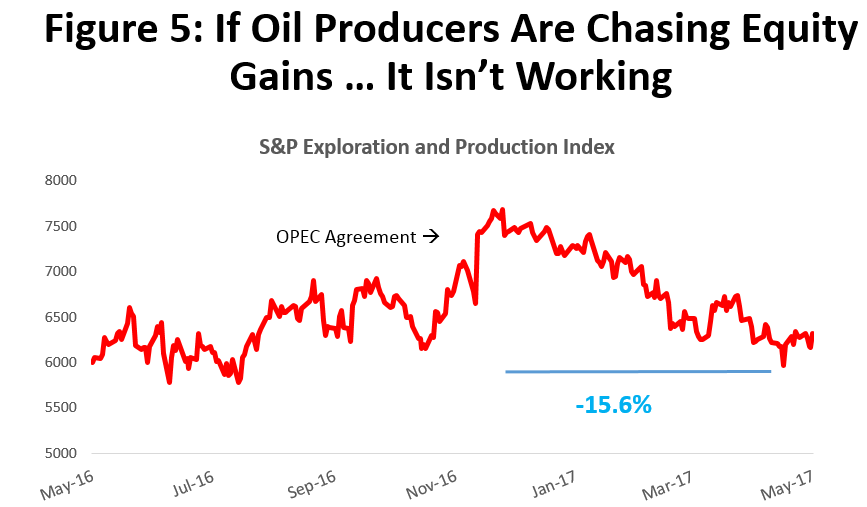
There is substantial agreement that U.S. fracking activity has moved too far and too fast, growing U.S. production at an uneconomic pace. U.S. producers are again chasing equity gains at the expense of long-run profits, just as they did from 2012-14. Three factors have allowed them to increase drilling activity and U.S. oil production too quickly: the ability to hedge production in the futures market, access to high-yield borrowing for leverage, and oil service costs that have yet to rise significantly.
So far, their strategy, as seen in Figure 5, has failed miserably, with a 15.6 percent fall in producer equity prices so far this year. What is needed to improve behavior? The futures market appears to be moving into backwardation (a negatively-sloped forward curve) that would eliminate hedging; service costs are now rising, although only slowly; and continued poor financial performance should soon freeze them out of equity and high-yield markets. The key question remains: When and how does this fall together to instill producer discipline?
A return to healthy levels of drilling activity probably requires oil prices in the range of $60-65, enough to reward producers for moving to higher-cost reserves, and to pay service companies for their long-run capital costs. One major investment house has estimated that $50 is probably the minimum needed just to keep drilling stable at current levels, and the rig count could fall if lower prices hold for long. We need oil prices north of $55 to keep drilling on the rise, and near $60-$65 to spur a robust drilling recovery – one where disciplined oil producers pay attention to good business practices. Looking back at Figure 2, the futures market has yet to even see $60 oil on the distant horizon – with or without OPEC optimism built in to the forward curve.
Three Scenarios
With the course of oil prices as uncertain as ever, we will work through three scenarios for oil prices and drilling – high, medium, and low – and then look at the implications of each scenario for Houston jobs. If later this summer, for example, a high oil-price/high-drilling scenario clearly emerges, we will know where to shift expectations in terms of oil jobs and the Houston economy. Meanwhile, a probability-weighted outlook might be the better approach – perhaps reflecting uncertainty with a 25% chance of the high scenario, and 60% for the medium, and 15% for the low.
History provides no simple formula for how this drilling recovery might unfold. Since 1982, we have experienced four other major downturns in drilling, and in each case Figure 6 shows the behavior of the rig count after oil prices made a definitive turn upward. In the 1982-87 recovery, for example, we see no significant recovery, but a decade where the number of working rigs never moved up by much, and drilling stayed near the trough.
This lost decade was brought about by OPEC and the Saudis holding millions of barrels of daily production off the market in 1982-86 in a fruitless attempt to prop up crude prices. After watching their market share fall from 49 to 28 percent by 1986, OPEC realized the hopelessness of the mission they were on. They dumped millions of barrels of shut-in production into world markets, and oil price collapsed. With the return of these OPEC oil supplies, there was really no need to drill for a decade or more.
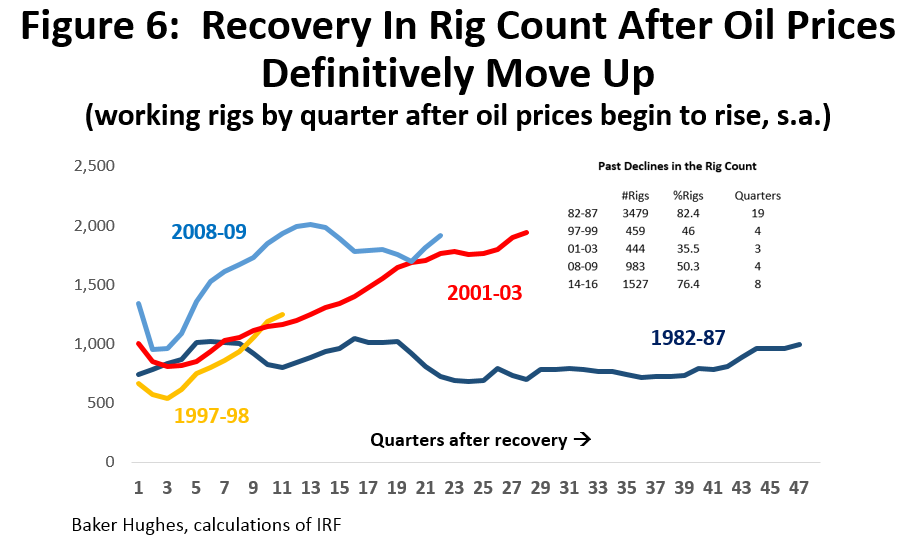
In contrast, the recovery from the 2008-09 downturn came very quickly, as emerging markets bounced back strongly from global recession. The commodity boom that began in 2003 moved right back on track, and pushed oil prices to $100 per barrel. The recovery that followed the 1997-98 Asian Financial Crisis was strong, but was shortened by the 2001-03 Tech Bust and U.S. recession. The 2001-03 recovery turned into the early stages of the Fracking Boom, and lasted nearly six years. None of this history provides much of a guide for current events, with U.S. fracking as swing producer in global oil markets.
Given the variety of recoveries, and the current uncertainly about the near-term path of oil prices, we have set up three scenarios for Houston’s oil sector. See the summary in Figure 7.
- When will oil prices turn up? Oil has probably made a definitive turn off of a cyclical low of $30 per barrel in February 2016. The key question now is how soon prices return to and stay near $50 or better to stabilize the rig count and prevent a decline in drilling; or move to $55 to keep the rig count growing moderately; or when they return to $60-$65 to bring robust and healthy recovery. Our high scenario assumes a quick turnaround in oil prices, with a sustained push to $60 or more. The moderate scenario has a push back to $55 by the second half of 2017, and the low only sees $55 in early 2018.
- When does the rig count turn up? Following a turn upward in oil prices, the rig count usually follows in about two quarters. The on-going drilling recovery saw oil prices rise in February, and drilling began to rise in early June. While there is some sentiment that – once it got underway – this recovery moved too quickly, our high scenario assumes this rapid growth in rigs and drilling activity continues. It slows from the recent frantic pace of 2017Q1, but still drives a robust expansion of drilling. The moderate scenario assumes even more of a slowdown in 2017, before catching fire later in the year. The pessimistic low scenario sees the rig count fall back sharply to 600 working rigs by the end of this year, with slow recovery beginning again in 2018. It is meant to be pessimistic, and is given only a small chance of happening.
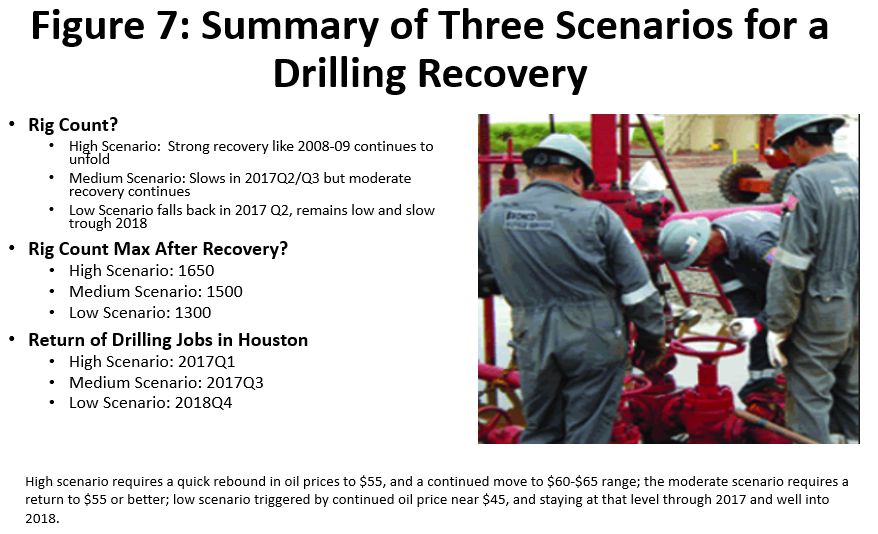
- How high does the rig count go? The rig count peaked in 2014Q2 at 1911 rigs, driven by oil prices at or near $100 per barrel for many months. Without $100 oil, it is unlikely that we will see 1911 rigs anywhere in our forecast horizon. We assume that the high forecast peaks at 1650 rigs, the moderate forecast at 1500 rigs, and the low at only 1300.1
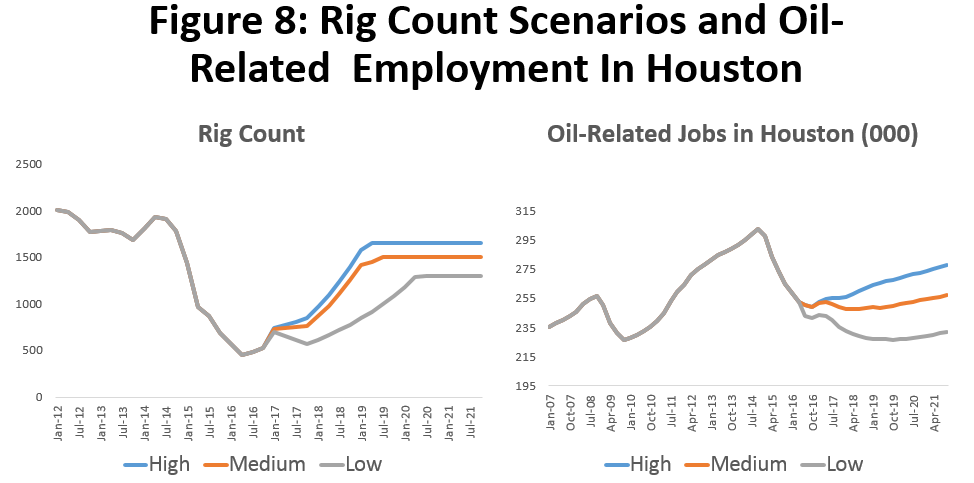
- When do oil-related jobs return to Houston? Our high scenario implies that oil jobs are already coming back. (See Figure 8) Payroll employment data through April are now showing that 10,000 of the 77,000 jobs lost have returned. In the moderate scenario, we see further recovery delayed, and a further push in local energy hiring returning later in the second half of 2017. The low scenario foresees this return of hiring only in early 2018.
Houston Job Gains: Are They Real? Can They Continue?
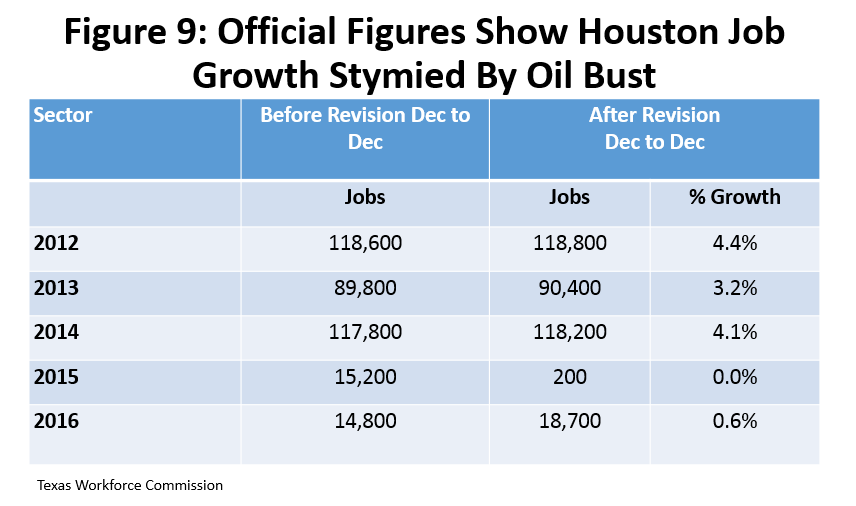
The March benchmark revisions to Houston’s total payroll employment affect the economic outlook by re-writing recent history and by moving our beginning point. Changes to recent employment estimates are not large, and they do not change the fundamental narrative of no-growth/slow-growth in Houston since 2014. The revisions did wipe out all job gains in 2015, as well as for the first eight months of 2016. (See Figure 9) The March revisions for all of 2016, however, showed a small increase to 18,700 jobs, with all the year’s new jobs coming in the last four months of the year.
Job growth since late 2016, as estimated by the Texas Workforce Commission, has been very strong. In fact, according to their sample data, over 50,000 jobs have been in Houston added since late 2016.
We need to be skeptical of such strong job growth. First, are the gains real? The numbers are estimates, and we have seen similar strong bursts of job growth revised away many times over the past two years. Cautious skepticism is demanded. For example, the Quarterly Census of Employment and Wages provides the basis for future payroll employment revisions, and data just became available for 2016Q4. Future revisions no longer see that quarter as marking the turn-around point for Houston, but as just one more quarter of no job growth. This would wipe out all of the estimated 18,700 jobs from 2016, and leave essentially zero job growth from December 2014 to December 2017. How much faith do we now put into the strength of the preliminary estimates for the first four months of this year?
Second, can these gains continue? Much of this recent job growth was built on a burst of optimism about the November OPEC agreement, and – as we saw earlier in Figure 2 – higher price expectations were fully purged from the market by March. The recent OPEC extension has done little or nothing to revive it.
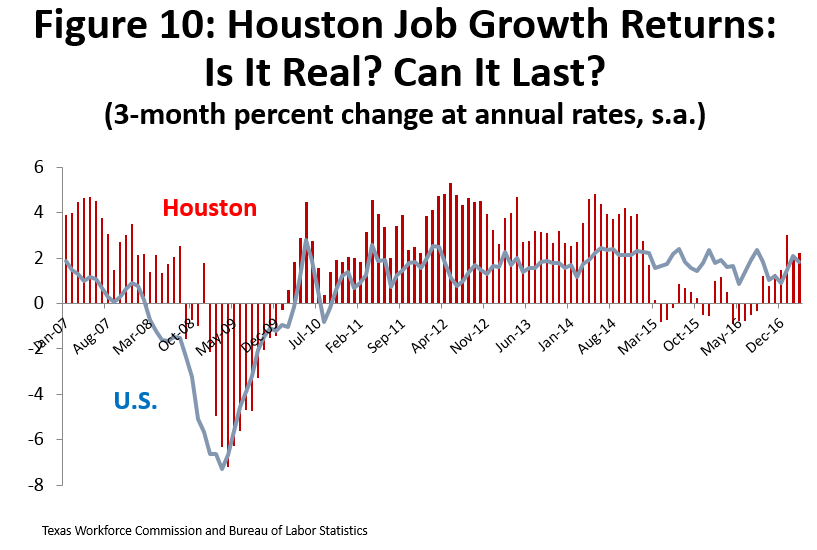
Figure 10 shows Houston’s total employment data for 2015-16 as revised in March, as well as history since 2007. The numbers are monthly percentage growth rates for payroll employment stated at annualized rates and compared to the U.S. The strong local job growth of the fracking boom evaporated almost immediately in 2015 as oil prices fell, and job growth stayed near zero until just the last few months. The more recent jobs are the product of higher oil prices that rose to near $55 for several months, but the Workforce Commission’s job growth estimates for December to April are startlingly high. For the first four months of 2017, they total 33,200 on a seasonally-adjusted basis, headed for nearly 100,000 if this growth continued through the year. It would mark a very quick and dramatic return to the days of the fracking boom – if this growth is real and if it were to continue.
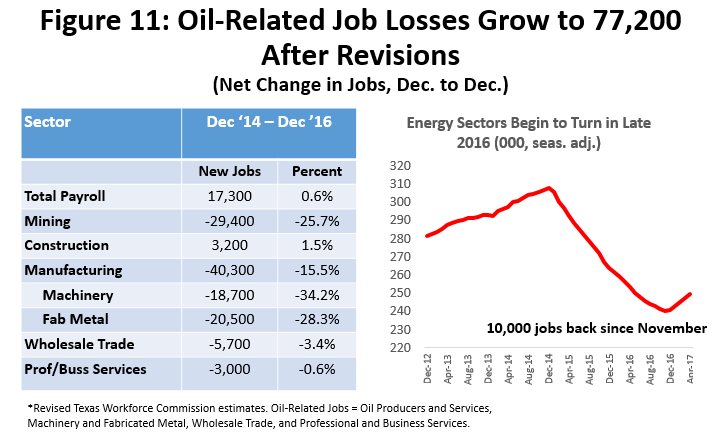
The depth of the downturn in Houston’s oil-related activity is indicated by Figure 11, which shows 77,200 job losses that we can attribute to the drilling collapse. They came between December 2014 and December 2016 in oil production, oil services, machinery, fabricated metals, wholesale trade and professional services. The number of oil-related jobs turned and began to rise in late 2016, and by April we had added back about 10,000 jobs.
Over the combined 2015 and 2016 period, Figure 11 also shows that construction was revised to 3,200 new workers, where previous estimates showed only 700 new jobs. However, this modest 24-month change disguises some major year-to-year changes in the performance of the construction sector. What was previously an out-sized gain of 12,100 jobs in 2015 is now only 5,600, and a large estimated employment loss of 11,400 jobs in 2016 is now only 2,100. The good news is the relatively small construction losses recorded in 2016, indicating that Ship Channel activity was still holding off on-going declines in commercial and residential construction. The bad news is that these losses likely will materialize in 2017, as East Houston’s petrochemical construction winds down rapidly.
If Houston’s recent economic problems are almost exclusively linked to the collapse of oil prices and record-low levels of drilling activity, what has offset energy losses? In part, it was continued U.S. economic growth that helped Houston’s many local employers that sell into national markets; it was low natural gas prices that triggered a major petrochemical construction boom on the Ship Channel; and at least through 2015, it was past momentum from the fracking boom. Between 2003 and 2014, Houston added over 700,000 new jobs, and just because the price of oil fell in late 2014, it did not mean that we had all the streets, hospitals, schools, shopping malls, apartments, and general infrastructure required. Unfortunately, by 2016, that boom-time momentum was largely spent. We will spend the next couple of years trying to rebuild it.
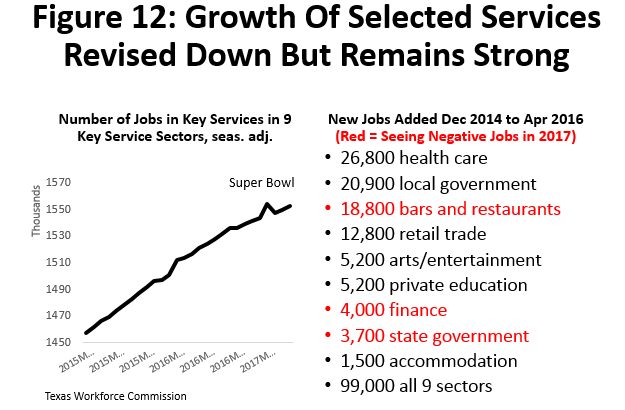
Figure 12 outlines the latest estimates of job gains or losses since December 2014 among key service industries that are caught up in these trends, and that have provided most of the offset to the oil bust. These are not jobs that drive the economy, but mostly secondary activity that come in the wake of local economic growth – medical services for a growing population, new restaurants and retail stores, entertainment, schools, etc.
With the loss of momentum through 2016, these sectors should be slowing, but instead provide over half of recent estimated job growth. The graph in Figure 12 shows little slowdown in the rate of growth, even though the sectors highlighted in red on the right side are already recording negative numbers in early 2017. It seems likely other sectors will soon join them, or eventually be revised to slower growth.
Other News on Houston's Economy
Payroll employment is not the only regular report we receive on Houston’s economic performance. If payroll employment has recently turned positive, the rest of the news is mixed at best. The local unemployment rate – often seen as a lagging indicator – continues to rise, auto sales and sales tax collections remain in decline, and – in contrast – the Houston Purchasing Managers’ Index (PMI) is now pointing to very strong growth ahead.
Houston’s unemployment rate stood at a seasonally-adjusted 5.8 percent in February, compared to the 4.4 percent rate for the U.S.2 (Figure 13). More than 52,600 local workers have been added to the unemployment line since the downturn in oil began. Growth of the labor force has slowed sharply. From 2011-2014, an average of 55,000 new workers joined the labor force each year, but in the last two years annual growth has been only 32,000 new workers.
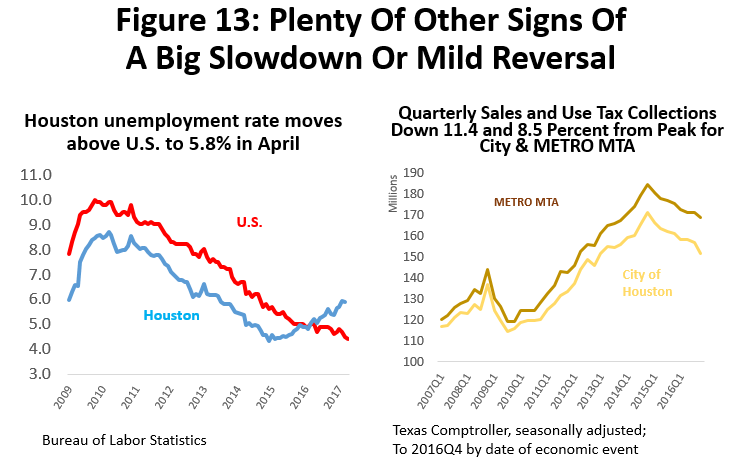
Based on the date of the economic event that triggered the tax liability, sales tax revenues for the City of Houston and METRO were still falling hard through the end of 2016.3 Seasonally-adjusted quarterly data in Figure 13 show that revenues peaked in 2014Q4, City collections had fallen 11.4 percent by year-end, and METRO MTA by 8.5 percent. Earlier signs of possibly slowing the rate of decline of sales tax collections, or even bottoming out, disappeared with losses accelerating in Q4. The recent Super Bowl created a one-time bonus in early 2017, but revenue losses probably continued into the first quarter of 2017 if the Super Bowl is put aside.
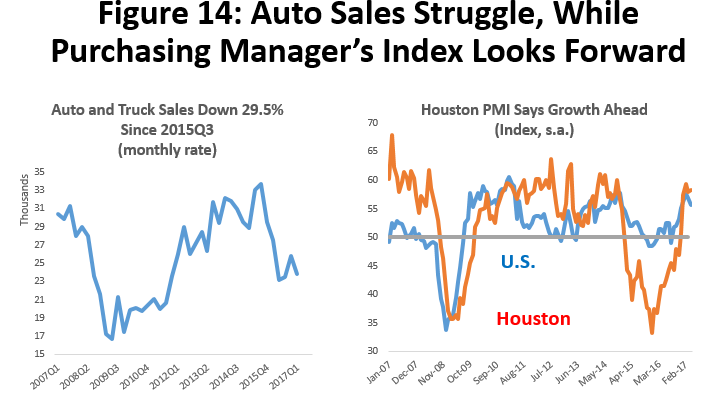
Figure 14 shows two more data points on Houston’s recent economic performance. Seasonally-adjusted auto and truck sales were down by nearly 30 percent through the first quarter of this year. They seem to be ending the contraction, but have yet to make any definitive turn up. This kind of fall in spending for large consumer durables is usually indicative of lost consumer confidence.
The Houston Purchasing Managers’ Index (PMI) is set so that index values above 50 indicate expansion, and values less than 50 mean contraction. The index slipped below 50 in January 2015, and stayed there for 23 months. (Figure 14) The index began rising in December, and in April it was registering a strong 58.2.4 As a leading index, it is pointing to very strong growth in Houston over coming months. The key question once more: How much of this renewed confidence in Houston’s economic future was based on the fall OPEC agreement and an expected rise in oil prices? Is this optimism is still with us? The latest April report showed that the PMI staggered a bit, but remained very strong.
The U.S. Economic Outlook
As we have done in all our reports over recent years, we assume that the U.S. economy continues to grow at a moderate pace throughout the forecast horizon. This is important because past sharp declines in oil prices and drilling activity were often accompanied by U.S. or global recession. In this downturn, U.S growth has been an important source of growth for many Houston businesses that sell into national markets. We assume similar support continues through the forecast horizon.
The excesses that brought on the Great Recession now have been remedied and slowly worked out of the system. The U.S. financial system is healthy; the consumer has deleveraged; state and local governments across the country are collecting healthy sales and property taxes; and the U.S. housing market sees rising sales and higher prices.
Concern is sometimes expressed about the age of this expansion. It began in June 2009, but expansions die of speculative excesses – not old age. It took several years of very slow growth to work through the damage from excesses of the early 2000’s, and new problems (maybe in housing, tech, or the broader stock market) have only begun to build over the past couple of years. Barring some large and unanticipated external shock, this recovery still has some life left in it.
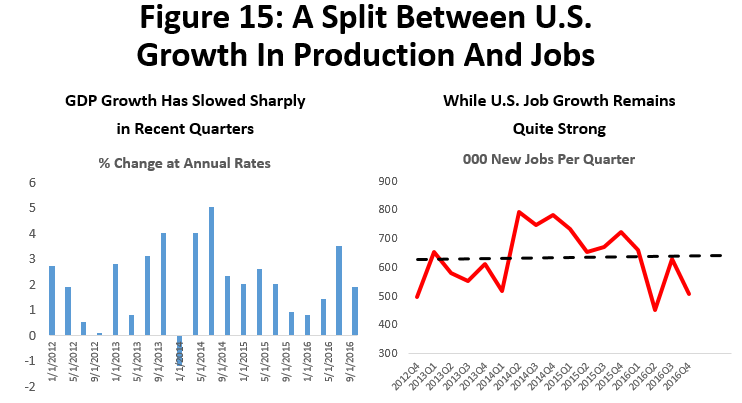
Since 2015, we have seen an unusual split emerge in the U.S. economy, with weakness in broad measures of production combined with sustained solid growth in employment. (Figure 15) This could be because of recent weak growth in productivity or output per worker, which we have certainly seen over the course of the recent recovery. But to explain recent events, productivity growth would have to be much weaker than currently measured. The more likely cause is a weak export sector that is driven by a feeble global economy and very strong dollar, while the domestic economy remains very robust. The weak U.S. export sector tends to damage manufacturing and goods sectors, while the strong domestic sectors favors high levels of hiring.
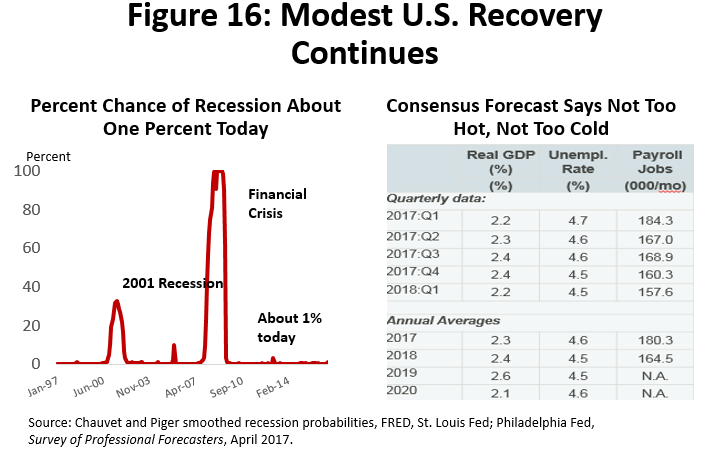
Figure 16 shows the Chauvet-Piger smoothed recession probabilities, which show less than a one percent probability of near-term U.S. recession. The first few quarters of the U.S. employment outlook used in our forecast are taken from the Philadelphia Fed’s Survey of Professional Forecasters. Longer-term estimates assume growth continues at a steady 200,000 jobs per month through 2021. Because of the importance of the U.S. economy to Houston’s growth, especially at a time of oil market weakness and uncertainty, this assumption of sustained U.S. expansion presents a definite risk to the outlook. While the probability of U.S. recession remains quite low, U.S. recession would have a material impact on the outlook.
Ship Channel Construction
Along with U.S. economic strength, a major boom in petrochemical construction provided substantial support to the Houston economy during the 2014-15 drilling downturn. Profits in the downstream oil processing industries (refining and petrochemicals) often run counter to upstream drilling, as high oil prices represent an increase in feedstock costs. High feedstock costs force higher prices for gasoline, jet fuel, etc., and usually mean lower profit margins. When energy prices fall, however, feedstock costs fall to the benefit of refining and petrochemical profits. Integrated oil companies like Shell, BP, or ExxonMobil find better balance in their profits over the oil-price cycle by having significant holdings in both upstream exploration and production and downstream processing.
Among major metro areas, and even among large oil centers, Houston is unique in having both large upstream and downstream operations. Comparable to Beaumont/Port Arthur or New Orleans, Houston is a major Gulf Coast refining center. And the Houston Ship Channel stands alone as the largest and most important point for U.S. petrochemical production. The refiner turns crude oil into oil products like gasoline, kerosene, or jet fuel, while the petrochemical producer makes intermediate products that become plastic and synthetic rubber. Houston’s size and balance between upstream and downstream operations makes its oil-related activity analogous to integrated companies like Shell or ExxonMobil, while exploration, drilling and production centers like Midland, Odessa, or Tulsa are better compared to independent producers like Apache or Anadarko.
The source of the current construction boom has been described at length in past reports. U.S. natural gas prices collapsed in 2013, and set up a substantial difference between the costs of energy derived from oil versus natural gas. Figure 17 shows both oil and natural gas prices, with gas valued at its energy-content equivalent in terms of dollars per barrel. In late 2014, for example, oil was $100 per barrel and natural gas was priced at the equivalent of $20 per barrel.
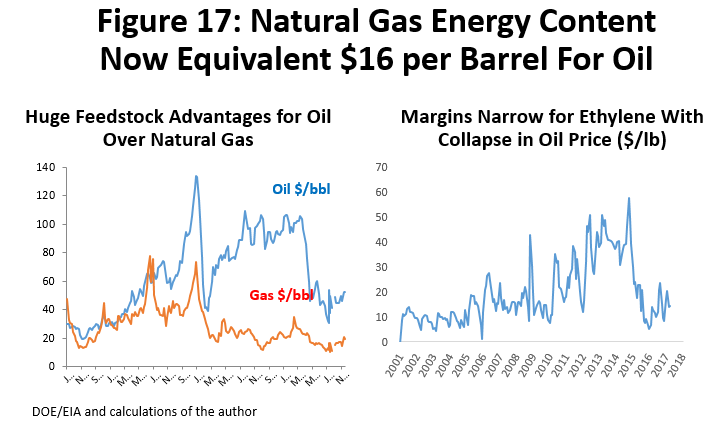
This is important because North American producers use natural gas liquids as the primary feedstock for plastics, while much of the rest of the world uses oil-based naphtha. The gas liquids (propane, butane, and ethane) are priced much like natural gas, and naphtha is priced like oil. This set up a period of enormous competitive advantages and profits for North American chemical producers after the price of natural gas collapsed, and they immediately began to expand capacity. Chemical companies from Europe to South Africa also realized that they could no longer compete with the Gulf Coast from their home base, and that their future demanded a North American, natural gas production base. The cost advantage of natural gas liquids may have narrowed with the collapse in oil prices, but once oil returns to $60 per barrel, the Gulf Coast competitive advantage again becomes very wide.
The American Chemistry Council estimates that over $170 billion in new U.S. industrial construction has been driven by fracking and low-cost natural gas, most of it occurring on the Texas and Louisiana Gulf Coast. Beginning in 2013, over $50 billion of this construction arrived in East Houston and along the Ship Channel. The resulting construction boom has been a temporary but timely addition to Houston’s economy.
The breakout of construction data from the Texas Workforce Commission (TWC) and Bureau of Labor Statistics (BLS) provides limited insight into the size of the workforce engaged in these projects. However, the recently revised construction employment data is no longer showing major declines in local construction jobs in 2016. Since commercial construction has certainly slowed in the metropolitan area, especially in apartment and office construction, it means that the petrochemical activity probably remained strong throughout last year. This means that in 2017 East Houston construction will be a drag on local growth that is felt throughout the year.
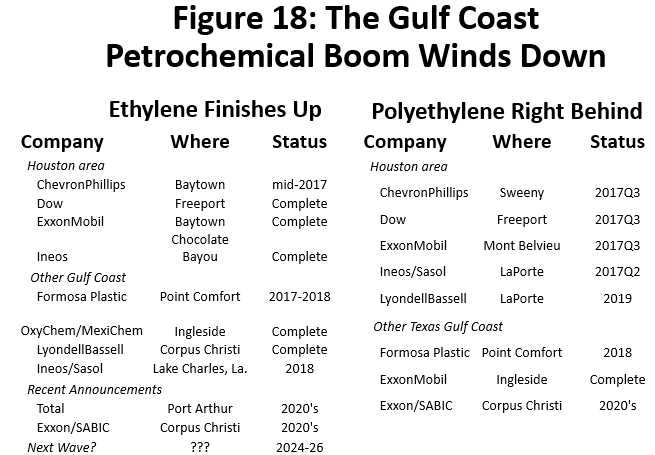
The most important news about this industrial construction is how rapidly it is winding down. Based on the project completion dates announced when construction began, 60 percent of the Ship Channel work ends in late 2016 and 2017. Figure 18 shows detail on some of the Houston metropolitan area’s large ethylene and plastics projects, and almost all will be mechanically complete over the next couple of quarters. Private surveys of the number of Houston-based construction workers needed in 2017 indicate that 15,000 to 20,000 may lose their jobs.
How Does It All Add Up?
How does it all fit together? The fracking bust is over, but considerable uncertainty remains about the path forward. We have three oil scenarios: the high scenario assumes that the recent rapid rate of growth in rigs continues, as the current strong drilling recovery simply roars on unabated; the medium scenario assumes recovery is slowed until late this year by oil-price uncertainty; the low assumes that the rig count falls in late 2017, and recovery does not resume until late 2018. Further, we assume in all cases that the U.S. economy remains a positive force, but the East Houston petrochemical construction becomes a drag on local growth.
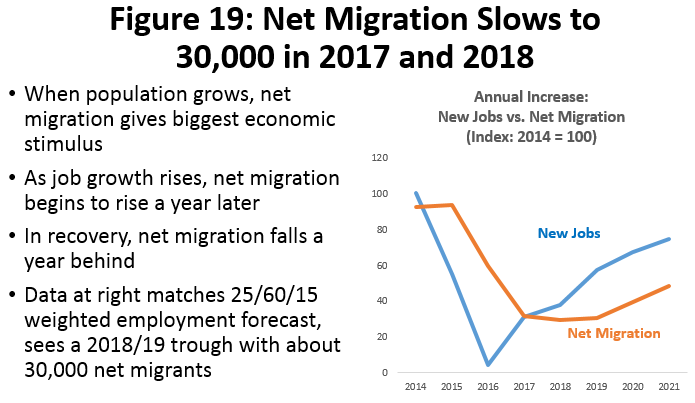
Finally, momentum from the fracking boom is largely spent. The boom ended in late 2014, and 30 months later we are mostly caught up on schools, highways, shopping centers, apartments, and office buildings. Net migration remains positive over the next two years, but the number of new residents will be only one-third of the 100,000 delivered in each of the final years of the fracking boom. See Figure 19.5
The employment forecast is shown in Figure 20. The range between high and low primarily reflects uncertainty about the pace of the recovery in oil. From 2017 and forward, job growth accelerates slowly in all forecasts, beginning in 2017 at 21,200 in the low and 54,300 in the high. The high forecast for 2017 is near a 2 percent growth rate, putting it near Houston’s average job growth of the last 25 years. The low forecast is subpar growth for Houston through 2019, but it also tells us that the Houston economy can register modest growth with little help from oil.
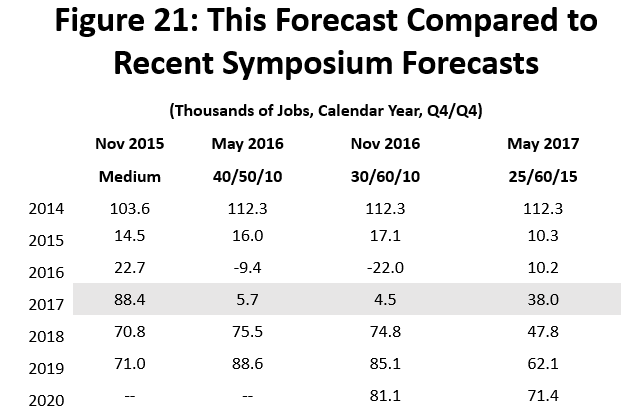
One useful way to think about these estimates – just as we did with the drilling recovery – is with subjective probability weights. My best guess is that there is a 25 percent chance that OPEC’s latest efforts to spur higher prices could work, that oil prices quickly recover as a result, and the rig count continues to move up rapidly, i.e., we follow the high scenario. Maybe there is a 15 percent chance for the low scenario, leaving a 60 percent for the medium. Then the weighted forecast of 37,900 jobs in the right column of Figure 20 becomes the best estimate.
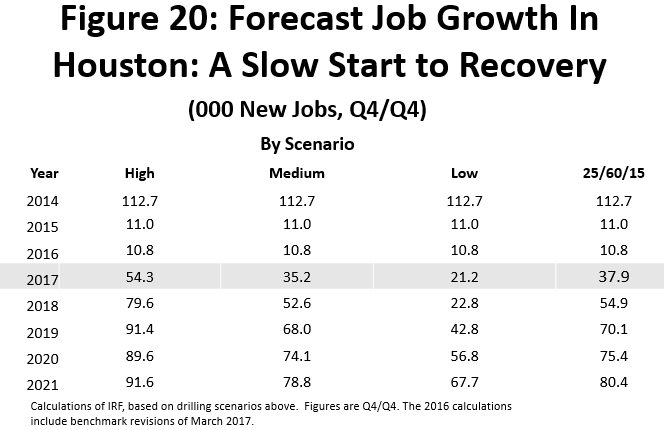
However, if oil prices pull back up to $55-$60 over the next couple of weeks or months, perhaps we change these weights to 60/30/10. This resets the weighted outlook for 2017 to 48,300 jobs, with similar improvement in later years. Alternatively, a further fall in oil prices shifts the weights to favor the medium and low forecast.
Figure 21 provides further perspective on the current forecast, by looking back at estimates made over the course of this drilling downturn. In judging the swings from faster to slower growth, remember that we are dealing with small numbers in 2015 and 2016. A one percent change in payroll employment is 30,000 jobs. Before the downturn – from 2012 to 2014 – job growth had averaged over 100,000 jobs per year, a 3.3 percent annual growth rate. The problem was to estimate Houston’s job growth after it was hit by a very serious reversal in its most important industry.
The recent oil bust rivaled the 1980’s in oil-industry damage, but the effect on Houston’s total employment was much less than many expected. Revisions to data – and revisions to revisions – also played a significant role in changing forecasts. For example, 2015 was revised down this past March by nearly 20,000 jobs, while 2016 was mostly unchanged. Despite the recent March 2017 re-benchmarking, the 2016 data remains subject to possible substantial revision next March, and we already have strong indications that 2016 will be revised down to at least zero job growth.6
Properly accounting for the on-going strength and positive role of the U.S. economy was important in keeping estimates in the right ballpark, as was recognition of the growth benefits of the petrochemical construction boom. Without help from downstream construction, Houston would have experienced a moderate recession. Without help from either petrochemicals or the U.S. economy, the recession would have been very serious.
Compared to the earlier forecasts, the current outlook has much less of a cyclical bounce in employment, and growth is flatter throughout the next five years. While the drilling recovery has arrived, it comes later than previously forecast. This delay means the decline in petrochemical construction is already well underway – and becomes a significant drag on overall job growth just as we start to bring back drilling jobs. Further, the drilling bust lasted long enough to allow all the momentum from the fracking boom to dissipate, and for net migration to slow for the next couple of years. We simply waited too long to move into a drilling recovery, and the result is no quick and easy return to job growth.
Written by:
Robert W. Gilmer, Ph.D.
Institute for Regional Forecasting
June 3, 2017
1 The “rig count” here assumes that rigs are modern recent equivalents in terms of technology. There are significant gains in productivity being made in drilling with multiple wells drilled from a single pad, increasing the length of the well bore being fracked, etc. They will continue to have an effect over the next five years. The recent productivity gains are often exaggerated, partly to hype the technology, and partly over confusion between productivity gains driven by technology, and cyclical improvement due to drilling in sweet spots and lower service costs. The recent economic environment has not been conducive to any major upgrading of the rig fleet.
2 The jump in the unemployment rate in early 2017 may – paradoxically – be seen as good news. After unemployment benefits are exhausted, it is common to for the unemployed to lose touch with the local TWC unemployment office. If not registered as unemployed, they are not counted in the unemployment data. This is true, for example, in rural areas where employment opportunities are well-known in a small community. But as soon as local plants begin hiring, many unemployed will re-register, and the local unemployment rate will jump. One early sign of an improving economy is a jump in the unemployment rate. For a one-industry downturn like Houston is experiencing, news of higher oil prices may have been the incentive needed for many oil workers to return to the TWC and register once more.
3 These are sales tax allocations through March, with Q4 stated by economic event including December, January, and February. Figures are in current dollars, with no adjustment for inflation.
4 These index values are different from the ones reported by the Houston Chapter of the Institute for Supply Management. In order to make the U.S. and Houston indexes comparable, I use the same calculations that are applied to the U.S. index by the national association of ISM, with only five unweighted variables included. Seasonal adjustment is also my own.
5 The rule of thumb for Houston net migration is that it is equal to .45 times last year’s job growth plus .50 times last year’s net migration. For example, in 2014, Houston had roughly 100,000 net migration and 100,000 new jobs. Over the next three years, if there was no job growth, net migration should be 100,000, 50,000, and 25,000. Actual net migration in 2015 and 2016, was 99,200 and 63,100; and with modest job growth in 2017, we forecast 33,600 in the medium forecast. Migration includes both domestic and foreign sources.
6 The Workforce Commission has already reported 33,200 jobs in the first four months of this year, and we are forecasting only 38,000? This relates to the earlier discussion about (1) whether the reported numbers are real, and (2) whether they can continue. Likely downward revisions to late 2016, already visible in Bureau of Labor Statistics reports, raise substantial doubts about the incredible strength of job growth reported in early 2017. Specific doubts center on center on construction and various key service sectors.