Houston Updates
-
Archive
- June 2025
- March 2025
- December 10, 2024
- September 14, 2024
- May 21, 2024
- March 19, 2024
- December 9, 2023
- June 16, 2023
- April 6, 2023
- March 17, 2023
- Dec. 19, 2022
- Sept. 14, 2022
- July 4, 2022
- March 27, 2022
- March 9, 2022
- September 2021
- April 2021
- March 2021
- September 2020
- August 2020
- June 2020
- April 2020
- March 2020
- January 2020
- December 2018
- June 2018
- March 2018
- February 2018
- January 2018
- September 2017
- September 2017 Post-Hurricane
- June 2017
- March 2017
- January 2017
- September 2016
- March 2016
- December 2015
- September 2015
- June 2015
- March 2015
- December 2014
- June 2014
- March 2014
- November 2013
- September 2013
The Economic Outlook for Houston After the Pandemic
March 27, 2022
With the COVID vaccines available since spring 2021, 98 percent of Houston’s contact-sensitive jobs in restaurants, bars, barber shops, retail, and other large service sectors are now restored. While a new future variant cannot be ruled out, the public now seems ready to put the pandemic restrictions behind it.
Houston has already added back a remarkable 300,000 jobs since the 2020 lockdowns ended and probably will add another 85-90,000 jobs this year. But be careful interpreting these large and impressive numbers. We are still 60,000 jobs short of restoring all the lockdown losses and have added back only 83.5% of losses through January. It will be the middle of this year before Houston adds enough jobs to return to early 2020 employment levels. We are not plowing new ground with these numbers and -- following two years of recession and recovery -- we are simply returning to a familiar starting point.
As the pandemic ends, we also lose the huge fiscal and monetary support from the federal government that was essential to keeping the economy afloat in 2020-21. Major stimulus programs like the paycheck protection program and supplemental unemployment insurance ended last fall, leaving behind only several smaller programs that will end by June. And as inflation has suddenly taken off, the Federal Reserve has announced it will move swiftly to restore higher short-term interest rates this year. The brisk economic tailwinds of the last two years become moderate headwinds in 2022.
With local COVID service sector damage now repaired, Houston’s growth in 2022 will be built largely on U.S. and global economic recovery. Like Houston, the U.S. economy will finally return to pre-2020 employment levels by the middle of this year, and the global economy will follow. But much of the world remains unvaccinated and COVID-related labor shortages, factory closings, and supply chain disruptions continue to plague the global business cycle.
Oil remains a significant part of Houston’s future growth. Although it is highly unlikely that the U.S. fracking industry will ever recover to near 2014 high rig counts or local jobs, it may be time to see fracking show financially responsible progress and add local manufacturing and job growth in 2022 and 2023. Post-Ukraine, the possible return of $100 oil is discussed in this report and its impact estimated. But the new financial reality for the U.S. oil industry means $100 will not have the boom-time impacts on the local economy it once did.
Sales Taxes and Spending in Houston
We use local sales taxes in this report as a measure of the effect of pandemic stimulus spending on Houston’s economy and as a way to demonstrate its large impact. Monthly tax payments to the City of Houston or METRO MTA are called allocations, and this one percent tax is initially paid by the collecting business to the Texas Controller, who in turn passed it to the City or METRO two months after the economic event that triggered the sale. We track spending by the date of the initial sale.
These allocations are a very broad measure of spending activity. They include the retail taxes that the public sees and pays daily, but they also include other kinds of consumer spending on consumer services from pool cleaning to dry cleaning, various arts and entertainment, and food service. But about half the allocations are not paid directly by the consumer but by businesses in construction, manufacturing, wholesale trade, professional services, etc. As we will see, consumer sales accelerated sharply with pandemic stimulus and the business payments fell sharply in the COVID recession.
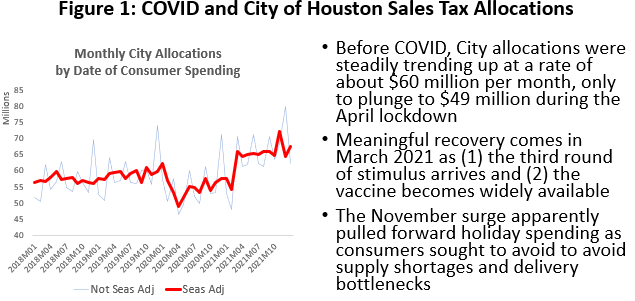
High levels of allocations continue in the most recent City sales tax revenue data. Figure 1 shows the post-COVID history of sales tax collections based on seasonally-adjusted current dollars and by date of the economic event that triggered the sale. Before COVID, sales in 2019 had been trending upward to near $60 million per month, only to fall back to $49 million in the April lockdown. City allocations stabilized and improved, but significant recovery does not come until March 2021, as fundamental factors took control of the outlook: vaccines became widely available that spring, Texas dropped many public health restrictions such as its statewide mask mandate and occupancy restrictions, and a second and third round of fiscal stimulus provided the public with a much-enhanced capacity to spend.
The data for recent months reflect an Omicron variant that proved highly contagious but milder and less deadly than earlier strains, and which now seems in retreat. The spike in November allocations probably reflects a pre-holiday effort by consumers to shop early in the face of sharply rising inflation, supply chain shortages, and other delivery bottlenecks. Through January, sales remain strong.
This good news has to be tempered, however. The COVID stimulus payments are rapidly ending, leaving households to return to pre-COVID budgets without bonus revenues or surplus savings. Most important, we face national and global economies that are not expected to see full recovery before the middle of this year or later. Houston’s recovery, in particular, lags the rest of the state and nation.
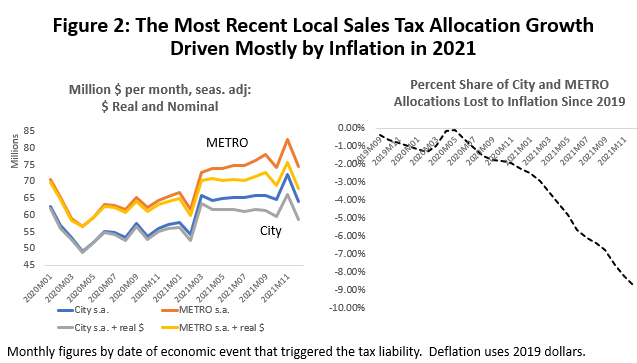
The other key factor in these recent allocations is an outbreak of inflation that saw consumer prices surge 6.9 percent in 2021. See Figure 2. Inflation is, at least partly the outcome of the massive stimulus that arrived just as the vaccines became effective, allowing the public to engage in normal economic activities again. COVID fell back just as the cash arrived, and it left too much money chasing too few goods. Further, the global economy – where only two-thirds of the population is vaccinated – is still subject to COVID-driven labor and material shortages that also worked to raise the costs and prices of goods.
Whatever the cause, all of the apparent growth in allocations in recent months disappears once we allow for inflation. While inflation delivers more revenue, it similarly raises the cost of everything in the City or METRO budget from labor to supplies.
The End of COVID Stimulus
Fiscal stimulus was an enormous injection of cash into the economy that is rapidly coming to an end, and now it must be replaced by local economic growth. The stimulus came in two waves of about $2.5 trillion dollars each, first in early 2020 during the lockdown period, then followed by two more rounds in late 2020 and early 2021 that again totaled the $2.5 trillion. Two and a half trillion dollars was about $16,800 per U.S. household in 2020, and each round saw about half of this cash flow directly or indirectly -- but quickly -- into the bank accounts of individuals and businesses through economic impact payments, the paycheck protection program, and enhanced unemployment checks.
In Figure 3 the blue line shows the pandemic-period track of total personal income (including stimulus) and the red line is the wages, salaries, and income of the self-employed (no stimulus). Each point compares these measures to pre-pandemic levels in February 2020. The initial round of stimulus came against a backdrop of consumer shock and lockdowns, and a ten percent drop in early wages and salaries that was immediately matched by ten percent jump in personal income via stimulus. These cash payments appeared to quickly right the economic ship by mid-year by offsetting wage losses and delivering record levels of income. Pre-pandemic levels of wages and salaries were fully restored by November 2020.
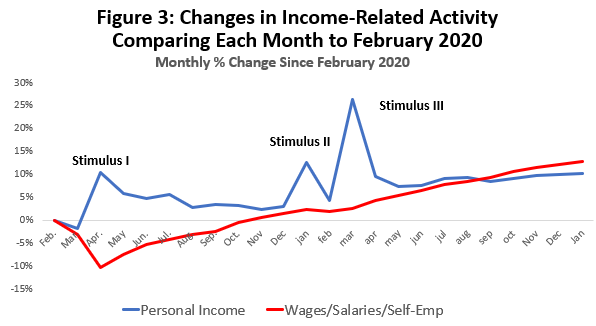
The lockdown month of March 2020 was the only month that U.S. personal income has fallen below pre-pandemic levels, telling us that consumers have had the wherewithal to spend if they chose to do so. In fact, collectively, Americans had never before been so well off financially. Beginning last fall, however, we began to see weakness creep into personal income growth relative to wages and salaries as the stimulus worked its way out of the system. Further, American consumers proved adept at rapidly spending the extra cash that piled up in their bank accounts and little post-COVID financial cushion remains. According to the Bureau of Economic Analysis, both the U.S. savings rate and total U.S. personal savings have returned to near-normal levels below. Credit card spending by consumers has begun to rise again. From here on, the economy is largely running on its own power1.
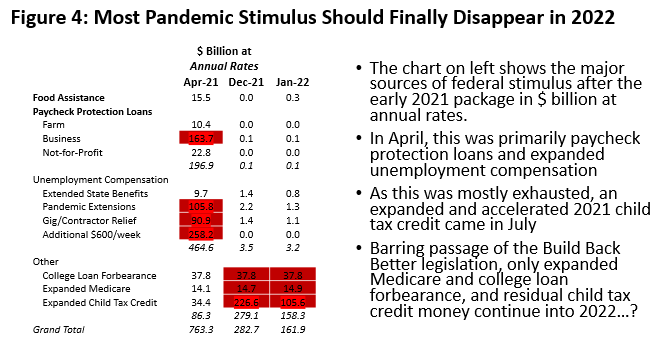
Figure 4 shows how fast the stimulus has disappeared. The first column for April 2021 is just after the final round of stimulus, and it shows that the paycheck protection program and enhanced unemployment compensation programs dominated spending, running at $763 billion at annual rates. Almost all of these programs ended last fall, and by January fiscal spending was $161.9 billion at annual rates via expanded Medicare, college loan forbearance, and a new enhanced child tax credit that came in July. The tax credit should rapidly disappear as taxes are filed and the other programs will close by June.
Can the Houston and U.S. and Economy Replace the Stimulus?
Figure 5 shows the obvious timing of heavy U.S. retail sales spending following each round of fiscal help; first, returning retail activity to pre-pandemic levels by June 2020, followed by the sharp pick up in spending that comes in March 2021 and continued through December.
If we looked back by retail sector on the right side of Figure 5, at the peak of the pandemic we would have seen a distinctive COVID-related pattern marked by large declines in food service, clothing, and gasoline, along with large historic gains in e-commerce as social distancing prevailed. The gains in remote purchases have continued, but otherwise a more normal pattern of spending by sector is seen today that has been restored by vaccination and a retreat of the COVID virus.
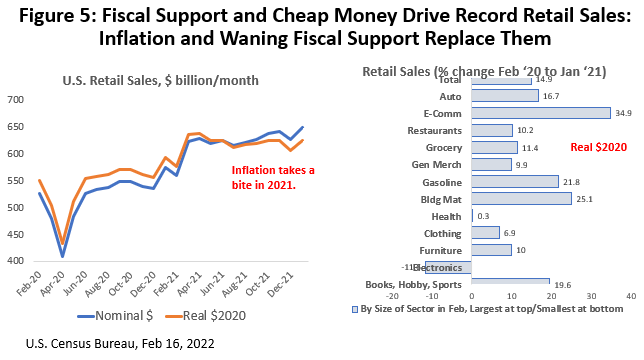
The economy is expanding rapidly on its own with personal income up 10.7% by January and wages and salaries up by 12.7% above early 2020 levels. But with stimulus being withdrawn throughout the last six months and emergency savings exhausted, U.S. retail sales should fall back toward levels supported by the economy alone -- but perhaps not fall far. The cushion from increased wages and personal income from pre-COVID levels implies we should see an increase in retail sales and food service of perhaps 9-11% percent instead of the current 11-13% above pre-COVID sales.2
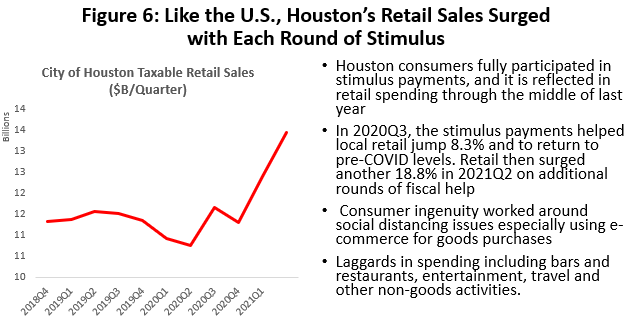
There is no reason why Houston would not have participated fully in the federal stimulus payments, and participation is fully reflected in local retail sales. In 2020Q3, the stimulus payments helped local retail sales jump 8.3% and to return to pre-COVID levels. Retail then surged another 18.8% in 2021Q2 on additional rounds of fiscal help. Consumer ingenuity worked around social distancing issues especially using e-commerce for goods purchases. Laggards were in service sectors rather than goods, with spending slower for bars and restaurants, entertainment, travel and other non-goods activities. (Figure 6)
Local big-ticket items strongly benefitted. Auto and truck sales closely tracked the COVID pattern of lockdown decline followed by two rounds of stimulus-driven spending, and sales currently are below pre-COVID levels but only because of a shortage of chips and other parts to manufacture autos. Also, the price of the typical truck and auto in Houston has risen to over $50,000 per unit.
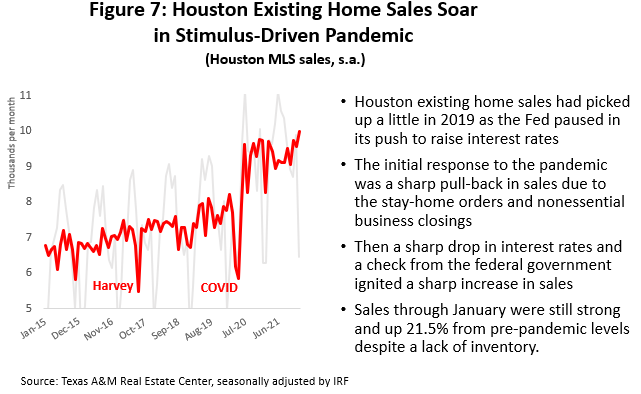
Houston existing home sales followed the COVID pattern and post-lockdown sales have remained at a steady 20 percent or more above pre-pandemic levels. (Figure 7) This was driven by fiscal help on a down payment, low interest rates, and a need for more room in the house as families work and learn from home. The median price of a typical existing home has risen to over to $300,000.
Allocations: Much More Than Consumer Spending
The discussion so far has focused on the ability of stimulus to give a big boost to personal income and consumer spending. But as discussed, the monthly allocations received by the City and METRO are only half-based on consumer spending, with the rest driven by a much broader cyclical patterns of spending by businesses in general and the oil industry in particular.
We don’t have a specific breakdown of allocation payments by industry, but a good approximation comes from the Texas Comptrollers data on taxable sales by industry. The data are not timely (now only available through 2021Q2) but they provide industry detail on 23 sectors. Figure 8 shows the sum of consumer-driven sales such as retail, food service, accommodation, arts and entertainment, and other services (blue line), while the rest is counted as business-related spending by oil, manufacturing, construction, wholesale trade, professional services, etc. Oil has a dominant role in the business-related spending cycle shown here.
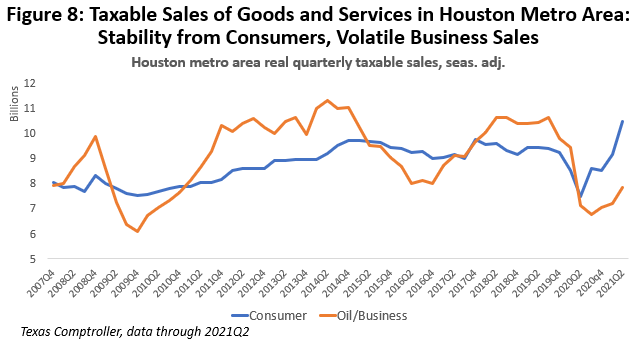
On average since 2002, the sales tax collections in the two sectors divide roughly 50-50 between consumers and business, but the shares of consumers versus business swings substantially over time and through the business cycle. The Great Recession, the 2015-16 Fracking Bust, and now the pandemic stand out clearly on the red oil/business line, while the blue consumer sales line – except for the pandemic -- is far more stable. Past volatility in allocations was mostly a product of business behavior, and especially oil-industry behavior.
The most recent data on taxable sales (1) suggests that there will likely be a correction ahead for the consumer sector and (2) the business sector -- less directly helped by stimulus -- is struggling on its own to make much progress. This business-sector problem is almost certainly rooted deeply in the weak oil recovery.
The chart sets up a key split for thinking about where sales tax revenues are headed. Although data end in mid-2021, based on allocations we know that there was a substantial improvement in consumer spending from stimulus. Then with the support for stimulus ending and a return to economic fundamentals, we should see consumer spending and allocations (blue line) fall back to normal trend levels in coming months. Adjusted for inflation, this trend line has been quite flat since 2014. We will see sustained improvement in the U.S. and global economy but, having set aside the early help from the vaccine as already achieved, this improvement begins from a relatively low point on the red line.
The Houston Economy in the Pandemic
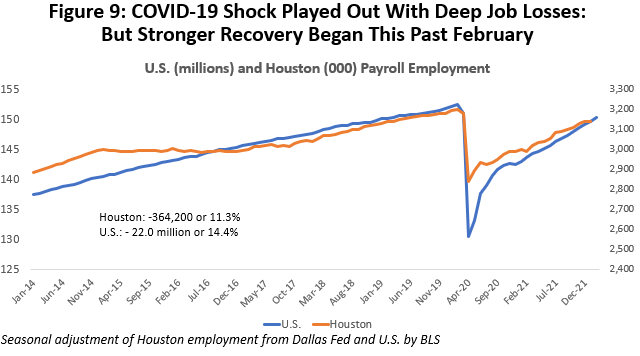
Houston’s COVID recovery brings very good news accompanied by some significant concerns. Certainly, the good news is that last year the Houston metro area added back 151,000 new jobs, led by vaccines returning by spring and by on-going economic recovery. The concerns, on the other hand, are raised by Houston’s economic progress significantly lagging the rest of the state and nation. The major culprit in poor performance is again the large local oil sector.
Houston’s payroll employment losses and recoveries are shown in Figure 9, with a lockdown decline of 367,200 jobs or 11.3 percent compared to 22.0 million U.S. jobs or 14.4 percent. Houston’s decline was smaller thanks to a less restrictive lockdown policy in Texas, and the stronger initial U.S. recovery was a strong bounce back as heavier sanctions were lifted. By this January, recently re-benchmarked and revised employment data shows that Houston has added back 302,400 of the lockdown losses or 83.25%, while the U.S. added back 19.2 million or 87.2%.
The differing stringency of lockdown periods complicates comparisons of the U.S. and Houston recovery, although the sustained advantage by the U.S. strongly suggests that Houston lags. Comparison to other Texas metros is much clearer in the sense that we had the same public health and lockdown rules imposed across the state. Figure 10 shows COVID lockdown period losses and recoveries through this January for other major Texas metro areas. Austin has recovered 145.1% of losses or all the losses plus 45.1% more. Dallas stands at 131.6% of jobs returned, Fort Worth at 101.6%, and San Antonio at 96.2%. The statewide recoveries are at 104.8%.
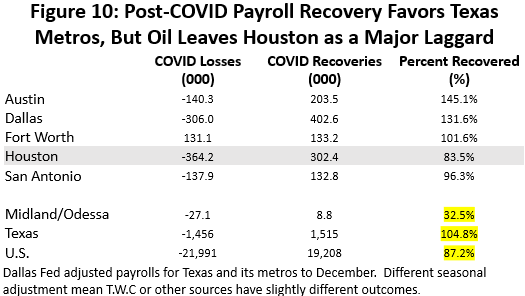
Note that Midland/Odessa have added back only 8,800 jobs since the lockdown of 32.5 percent. This is the heart of the state’s oil production region, and these cities -- like Houston – are highly dependent on oil-related jobs. This strongly tells us once more that Houston’s relatively slow performance is at least partly centered in its large oil sector.
How does the vaccine play into the broader economy? The immediate, huge job losses to lockdowns was led by jobs in sectors sensitive to close contact, social distancing, or heavily affected by COVID public health regulation. Nine local sectors are listed in Figure 11 that are sensitive to such contact (bars and restaurants, health care, retail sales, etc.), and which together made up 41.9 percent of all Houston employment in 2019, but also collectively accounted for 67.2% of the lockdown-period job losses.
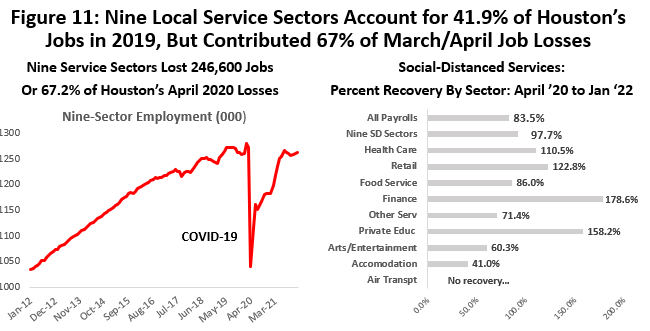
The key point about the vaccines is that they led a one-time surge in activity – especially regarding the return of payroll jobs -- that is largely behind us. We see that by January, 97.7 percent of the lockdown losses in these nine COVID-sensitive sectors were back, compared to 83.3 percent of total Houston payrolls. COVID damages tied immediately to the virus and public health regulations have been largely reversed by vaccines on a sector-by-sector basis. The three largest of these sectors – health care, retail, and food and drink service – also have high recovery rates at 110.5, 122.8, and 86.0 percent. For now, the surge in these jobs has peaked and can offer little immediate help to offset stimulus-related declines in allocations.
What About the Business Cycle?
What do we mean by business cycle in this context? To find the key drivers of expansion and contraction in a local economy, economists often look at a select group of sectors called the economic base.3 Basic industries are those that export their goods and services to the rest of the state, nation, or world. Exports bring fresh revenue and income into the metro area, drive local expansion, and create growth opportunities among secondary, inherently local activities like bars, restaurants, retail, dry cleaners, barbers, or most of health care.
When COVID struck, we have already seen in Figure 11 how most of the impact of social distancing fell on secondary industries with little ability to affect regional growth. The base, meanwhile, was little concerned with Houston’s lockdown. After all, base customers were not local but scattered across the state or around the world. But when the lockdown restrictions turned national and global, affecting every U.S. and many global cities, Houston’s economic base suddenly was included in the COVID damages.
Both the base and the contact-sensitive jobs fell hard and at almost the same time, but they did have to recover at the same time. Vaccines began to return contact-sensitive activity in February 2020, and 98 percent of employment is back in the 9 COVID-sensitive sectors. But the base has been less fortunate. While progress on vaccination is moving forward rapidly in the U.S. and Europe, there is less progress in the global recovery. Similarly, while there is solid progress in Houston’s secondary sectors like bars and retail, we see far less momentum in the key base jobs.
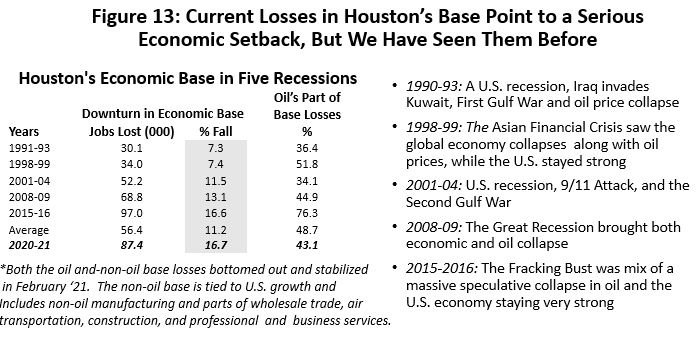
Figure 12 shows that historically about half of Houston’s economic base has stemmed from oil and gas, while the other half is export-oriented industries that depend on the national business cycle. The right side of the figure shows how the total base – oil plus the non-oil base – has moved through a 2018-19 oil-industry credit crunch and then the pandemic. During the COVID collapse -- between February 2020 and January 2021 – 87,400 of these important cyclical drivers were lost.
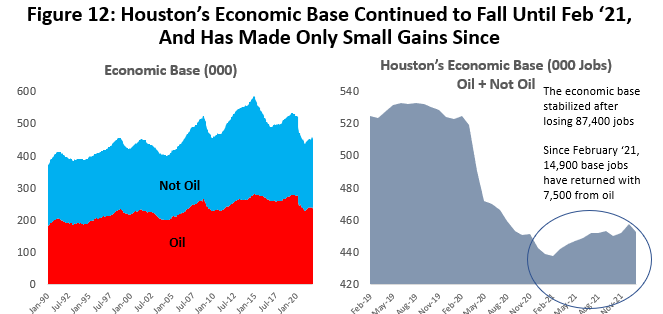
Most of the pain from base losses was concentrated in non-oil industries that sell to the rest of the nation or world accounting for 51,500 lost jobs, while the oil base fell by 37,650. Instead of quickly finding their footing after the lockdown ended, the base losses – oil and non-oil -- simply continued to mount through February of this year. Losses then stabilized in February, but by this January only 14,900 base jobs were back (7,500 in oil), and still accounting for the return of only 17.0 percent of the overall base losses.4
These losses to Houston’s economic base indicate a serious local recession, with its drivers being a moderate to serious U.S. recession combined with damage from oil. (See Figure 13) Oil-related damage to Houston’s economy is an inherent part of the local business cycle and has come in every Houston downturn since 1990. For the five cyclical setbacks since 1990 the average loss in Houston’s base was 56,400 jobs, and at the worst moments of this downturn basic losses totaled 87,400 or 16.7 percent. This would rank among Houston’s worst setbacks: the 2014-16 Fracking Bust lost 16.6 percent of base jobs and the Great Recession lost 13.1 percent. By this measure, the COVID downturn was unprecedented in its causes and its path of destruction, but it settles out as a serious but not unprecedented cyclical event.
What $100 Oil Really Means for Houston’s Economy in 2022
As this is written, the Russian invasion of Ukraine continues with a massive disruption of global commodities. In 2020, Russia ranked as only the 12th largest economy in the world or about the size of Italy, and its on-going aggression stems largely from a military of a million active-duty soldiers and its nuclear arsenal. Military aside, however, it also carries significant economic clout as a major producer and exporter of commodities, including wheat, gold, nickel, palladium, aluminum, and steel. It perennially ranks in the top three among the world’s oil producers, and Europe’s dependence on Russia’s natural gas pipeline system provides it with meaningful political leverage.
Over the longer-run, the rich supply of natural gas in the U.S. can offer reduced European dependence on Russia through LNG shipments. However, it is an expensive and long-term option for Europe that is made painfully necessary by current events. It will be good for the supply and processing base in gas-rich Texas and Louisiana -- if federal permits and licenses are forthcoming after the current crisis passes.
What about $100 oil? What does it mean for U.S. producers? And for Houston? The $100 beginning mark requires some discussion in the wake of decades of inflation. More important, the American fracking industry is not what it used to be. After three successive waves of oil downturns and producer bankruptcy in 2014-16, 2018-19, and 2020, a smaller and chastened American oil industry has emerged with a new financial perspective. So far, the industry has been extremely reluctant to chase higher oil prices at all, much less buy into a sustained multi-year commitment to oil prices at $100. It is unlikely that $100 oil will ever again mean what it once did to the industry -- or to Houston’s economy.
Sorting Out the $100 Oil Price
The history of $100 oil is immediately associated with long and enduring oil booms. First, this requires above all that the price of oil stay high for a long period of time. Let’s take a minimal standard of the price staying above $100 for at least two quarters. Further, as we look back over long periods back to 1973, we need to take inflation into account. Let’s use the U.S. consumer price index, rebase it to 2021 dollars, and ask when and how often we have seen $100 oil.
Since 1973 there have only been three such periods: the Iranian Revolution and its aftermath in 1979-82, the BRIC commodity boom in 2007-08, and a period of strong global growth from 2010-14 followed the Great Recession and pushed price up sharply. This latter period was helped along by continued and aggressive price support from OPEC. Adjusted for inflation, we see prices that have averaged $113-$136 for years and peaked as high as $148 over a single 90 day period. (Figure 14)
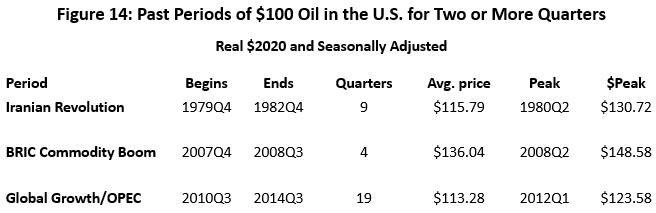
Each of the periods did bring a substantial increase in the U.S. rig count and domestic oil production. But just a few days into the current invasion of Ukraine and before the shooting stops, it is premature to assume that the price of oil will be over $100 per barrel if we look three months into the future. In a global economy that is just recovering from the COVID recession, we need Russian oil to flow again. A prolonged embargo probably hurts the U.S. and Europe as much as Russia. Further, even if the U.S. and Europe were to refuse to buy Russian oil there are other large purchasers like China (or just recently India) that would quickly step in to buy at the right discount. Otherwise, it is an easily transported and fungible commodity that can easily leak into world markets in substantial quantities.
A New Financial Model for Fracking
If inflation provides one perspective on the potential economic impact of $100 oil, so does the current state of the U.S. fracking industry.5 This is not the same industry that responded to the high oil prices of 2007 to 2014 with 2,000 working rigs. Fracking’s recent history is one of an industry that has been seriously damaged by a series of reckless investment decisions in the run-up to the 2014 fracking bust, by its continued actions after 2016 as it became clear fracking is a high-cost source of oil, and by punishing price cuts from OPEC+ that forced this reality on them.
- Growth of tight oil and natural gas exploded in the early 2000s, and it has since been boom and bust for American fracking. U.S. oil production boomed at 24.6 percent annual rates from 2004-2014 as a result of OPEC driving $100 oil prices, zero interest rates from the Central Bank after 2008, and speculative excesses by both the fracking industry and those who financed it. It was an oil boom that rivaled the 1980s.
- The fracking bubble burst in 2015-16 when OPEC slashed oil prices, but it took until 2018 and rising interest rates from the Federal Reserve before the last avenue of growth was cut off from this capital-intensive industry. With oil prices hovering at $50-$55 in 2018, the industry could neither improve equity values nor earn profits.
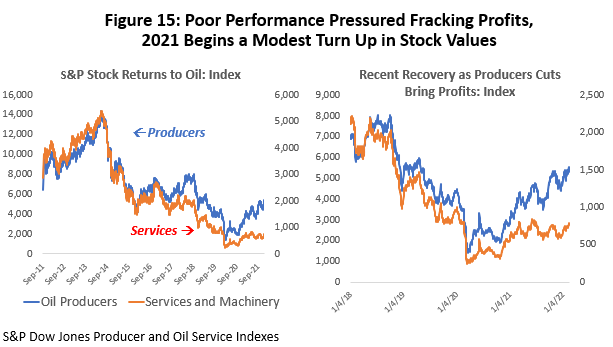
- In 2018-19 the fracking industry saw a severe industrywide credit crunch as Wall Street and the investor community turned its back on the fracking business. The S&P Producer Stock Index was over 14,000 in September 2014, but it had fallen to near 2,400 by August 2020. It has returned to only 5,300 today. Oil services and machinery suffered even worse losses. (Figure 15)
- COVID lockdowns and the Saudi-Russian oil war in May 2020 marked the low point for fracking – and posed a near-death experience for many companies. The rig count briefly fell as low as 270 working rigs, down from near 2000 in 2014, and has only recovered to near 600. The 2014, 2018-19, and 2020 reversals took $300 billion oil producer, oil service, and machinery assets through the bankruptcy courts.
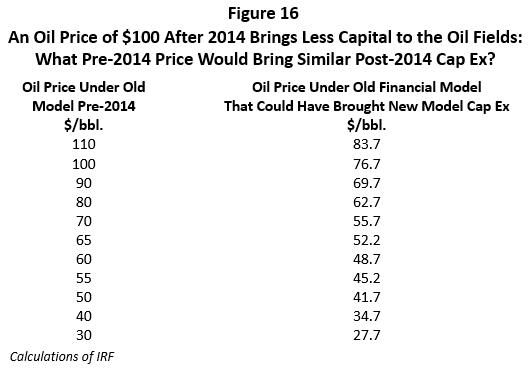
- Before 2014 the fracking industry – with the support of $100 oil – was a high-flying growth stock. All its free cashflow could be directed to the oil fields and new production. Today a smaller and chastised industry is a value stock that can attract investors only by committing 30% or more of it free cashflow to investors through dividends or by rebuilding its balance sheet. This means a smaller and slowly growing industry, and that any given oil price brings a smaller impact in the oil fields than in the past.
- How much smaller? Given the new financial model, how would the industry respond today to a WTI market price $100 oil? We know that the capital diverted to the oil fields under the new financial model will be less than before. Let’s ask the following “what if” question: Once we see the new lower capital spending, what if we had been working under the old model? Back in 2014, what oil price could have delivered this new lower level of capital? The answer is in Figure 16, and we interpret it as saying that what $100 oil delivers today as oilfield spending could have been bought for $76.67 under the old financial rules. For $65 oil, think of it today having the same impact on drilling as $52.70 would have in the old days.
Putting $100 oil aside, there is plenty of room for fracking to make some substantial gains in 2022-23. This was well before the Russian invasion of Ukraine, and we already had built meaningful increases in oil-field activity and local oil employment into our forecast well over a year ago based on financially responsible gains as the fracking industry’s financial health improved.
Until now producers have been very reluctant to react to improved oil prices as long as their financial position remained weak. Recent higher oil prices have offered producers this opportunity to respond with more drilling activity and production but with limited results. Oil prices have been over $70 per barrel for six months (Figure 17), but we just learned from Figure 16 that $70 now has the same impact as $55.70 would have had a couple of years ago. But the response of the rig count or local oil employment has been even weaker than $55 might suggest.
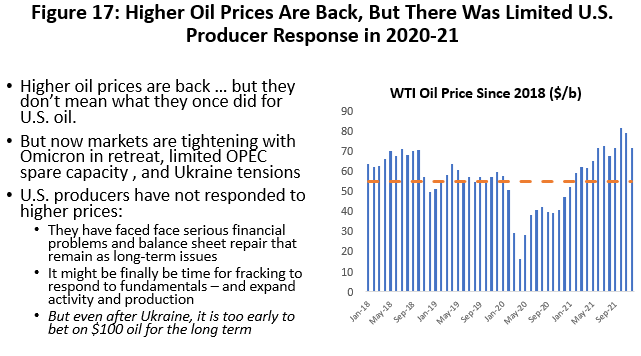
Caution is justified. As we have discussed, U.S. producers have been forced to make deep cuts in capital spending to appease current investors and attract new ones. Further, many have committed to holding the line on expansion of production until world growth stabilizes and OPEC spare capacity has been absorbed. This is a formula for higher oil prices – but not for increases in capital spending, rig counts, or new oil jobs.
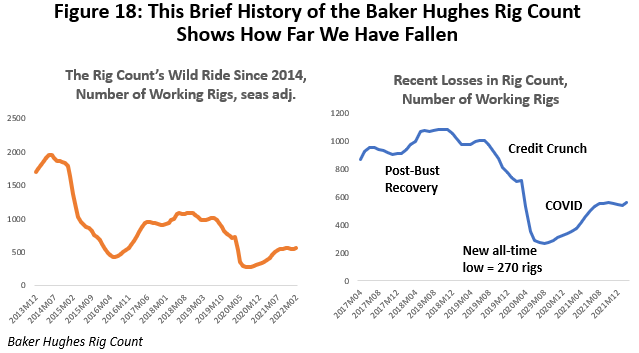
Slow and methodical recovery in the oil fields since 2020 appears in Figure 18 and the latest data on the rig count. Working rigs have made only limited progress over the past year. In 2016 the rig count fell from near 2000 rigs in 2014 to a seasonally adjusted all-time low of 433. The pandemic then crushed the record in August 2020 with a fall to 267 rigs. By this February, the rig count averaged only 561 or 55.5 percent of the rigs working at the last oil-field peak in June 2019. The seasonally adjusted rig count has barely moved since October of last year.
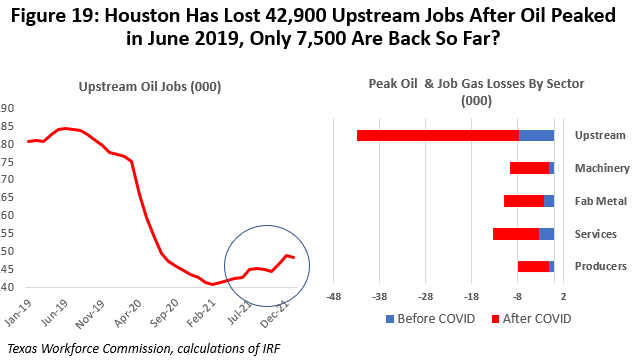
The trough in local oil-related employment came in September 2020 after Houston had lost 42,900 upstream jobs measured from the June 2019 peak. These are large losses but only just over half of the 77,200 oil-related jobs lost during the 2015-16 Fracking Bust. The 2015-16 collapse in Houston jobs resulted from a bubble that burst in U.S. fracking after oil prices fell hard in late 2014. Oil jobs hung on much better this time because the local job market had been substantially right sized by early 2020. Many of the oil jobs lost currently will return – but not quickly or soon.
Figure 19 shows changes in upstream oil jobs: producers, services, machinery, and fabricated metal. They are measured from (1) the beginning of the 2018-19 credit crunch and before COVID, and (2) after the COVID-19 outbreak to the present. The data through October still show these oil-related jobs up only 7,500 from the trough. Not surprisingly, most of the upstream losses have been in oil services and closely related machinery industries.
The oil downturn began before COVID-19 because of a serious industrywide credit crunch in the fracking industry. In terms of the number of losses, the COVID period of collapse was by far the most serious part of the downturn, but the on-going slow and partial recovery in rigs, well completions, and oil-related jobs has much more to do with pre-COVID credit problems than with COVID. There was a need to completely rethink the financial model for the fracking industry, and this is now well underway since mid-2020.
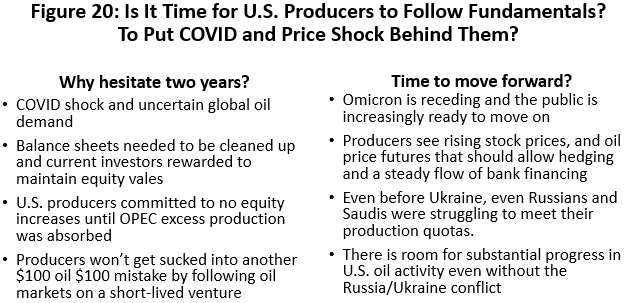
Amid the gloom, there is reason to think that perhaps the worst is over, and that is time for U.S oil to respond. Oil has been operating below fundamentals for good reason: COVID shock and uncertain global oil demand, because of their own poor financial position, and because many U.S. producers committed to not increasing production until all OPEC excess reserves had been absorbed. They were certainly unwilling – and remain unwilling -- to get sucked into another $100 per barrel oil venture that could lead to one more short-lived mistake. (Figure 20.)
But much of this has been fixed now with COVID disappearing, great progress in financial repair, and both Saudis and Russians struggling to meet quotas earlier this year before the Ukraine invasion. The blue line in Figure 21 is the recent history of the rig count. The red line is where U.S. drilling would be if a $65 price prevailed, if the new financial model were imposed, and in place of a COVID/Saudi-Russian Oil War, we had simply seen a moderate to serious U.S. recession and a run-of-the-mill period of $40 oil for two quarters. We then return to the world as we knew it in 2019, and the $65 price described the industry’s new long-term niche in world markets.
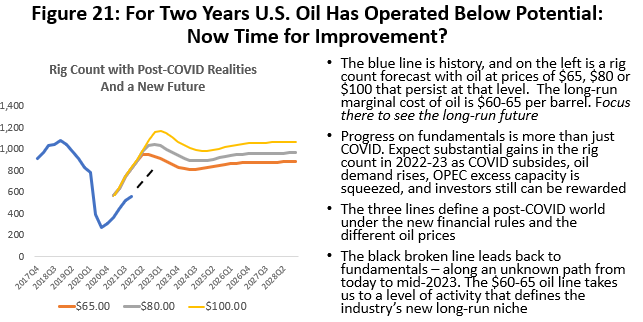
With Omicron in retreat and normal or better oil prices, we should be capable of moving back into this pre-COVID world and onto the higher “pre-shock” lines. At $65 oil, for example, we could move back to a rig count near 800 instead of 600, and a prolonged period of $100 oil might bring a 1000 working rigs. We would move back along the broken black line. How fast this happens and how far we really move is open to debate and no statistical analysis can tell us how this unfolds. But the potential for improvement has returned and is built into our forecast for local employment. And this is without the Ukraine invasion or $100 oil even being considered.
Even if we skip the $100 oil price, this is not a return to the 2000 rigs of 2014, but it does offer a chance for substantial improvement over the current count. While a hot war rages on, it is premature to assume that the current high oil prices can or will persist. Producers must be convinced they will remain high for a year or more, and in turn they must convince their investors it is the right move to expand the business. Significant long-term investments in labor and equipment will have to be based on these assumptions.
This works for local oil-related employment in Houston as well. Even with the new financial model in place, there is ample room to move forward with hiring. The latest decline in oil jobs began in 2019Q2, well before COVID and with upstream job losses reaching 42,900 by 2020Q4.6 We had returned only 7,500 of these oil jobs by 2021Q4 or 17 percent. If we follow the rules above for rigs – a new financial model, $65 oil, COVID/oil shock wearing off, producers willing to move forward – we could potentially see the return of 29,000 jobs by the end of 2024.
If $100 oil prices prevailed for three years and if producers bought fully into the durability of the $100 price for these three years, we could add another 20,000 jobs by 2024Q4. At best, any assumption about $100 oil are highly speculative at best while we wait for the end of a hot war in Ukraine and a better time to sort out the results.
Houston’s Employment Outlook
We know generally how payroll employment should perform over the next few quarters. We have seen the return of most COVID/contact-sensitive jobs since March 2021 although recent months have seen this growth slow and peak. These jobs now will return more slowly while we see accelerated growth in the important local base jobs that drive the business cycle. Both U.S. and Houston payrolls should match pre-COVID levels by mid-2022. We expect some gains in oil-related activity and employment in response to improved financial health among producers, and perhaps an additional leg up from higher post-Ukraine oil prices.
As we pull our forecast together, we will use a high, medium, and low outlook for planning purposes. We use oil prices as the vehicle to spread the outlook from high to low levels. For current planning purposes high oil price over this long time period remain near $80 per barrel and the low is $40. The medium or most likely price is $60-$65 per barrel, a price widely accepted as the long-run marginal cost of oil. In all cases we use the new financial model with 30 percent of oil industry free cash flow diverted to investors. This smaller industry limits our expectations for oil-field expansion and regional growth.
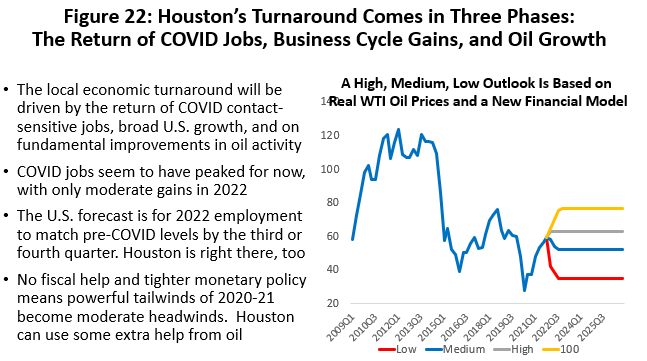
We have added the impact of $100 oil prices in Figure 22 to demonstrate their effect on the local economy if oil prices were to remain at that level for at least a year, when they could begin to add additional activity and jobs. Even if producers are satisfied with their financial status, it can take up to nine months for the rig count to fully respond to price gains and up to two years for a local jobs to complete their gains. These lags in equipment and jobs hold in the estimates for all price levels.
The pieces of the puzzle we need to put together for the employment forecast are in Figure 23. The blue line is recent history, and it reflects a sharp drop of 306,700 jobs in the second-quarter lockdown and shows that by 2021Q4 (at the end of the blue line) we are still 63,600 jobs short of the pre-COVID beginning point.
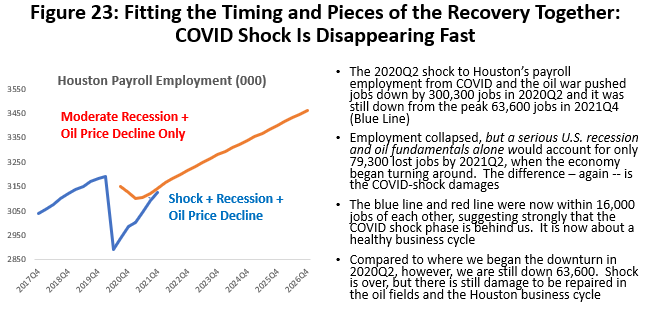
Assuming no new variants, the economic damage from the virus and remaining shock will be eliminated in the relatively near future, and we should soon move back to an economy running on market fundamentals. This would be a return to the red line. The red line reflects what would have happened in 2020 and 2021 if we had only experienced a moderate to serious U.S. recession and $40 oil – something we have seen several times before. The difference between the red and blue lines was COVID shock, with COVID disappearing but leaving economic damages behind.
Returning to the red line – growth as we knew it before the pandemic—yields our path for future fundamental-based growth that stretches out to 2026Q4 and beyond. These fundamentals are driven by the U.S. economy (from the Survey of Professional Forecasters and the Congressional Budget Office) plus the future oil prices just discussed.
The real question – one that cannot be answered by economists, statisticians, or epidemiologists – is exactly how we get from where we are today (at the tip of the blue line in Figure 23) and back to those fundamentals on the red line. In which quarter can we say that fundamentals are back and showing us where and how to connect the blue and red lines? How fast will we move along that broken line? With fundamentals taking control very soon – perhaps in a couple of quarters – it takes relatively few jobs to fill in that gap by guesswork.
Figure 24 shows the return of payrolls to long-run fundamentals in the low, medium, high, and $100 cases. The return of the contact-sensitive jobs, followed by the economic rebound, leads on to the long-run recovery of jobs from 2022 to 2028 as the red line rises slowly and steadily. This is our forecast of Houston’s future as far as 2028.
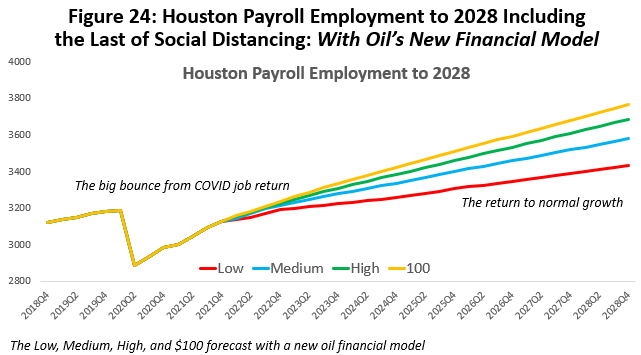
Figure 25 is our four forecasts of Houston’s payroll employment to 2028 based on annual changes that are measured from Q4 to Q4. Focus on the medium forecast and $65 oil and we see the loss of 192,100 jobs to the lockdown year of 2020, divided into 137,900 jobs due to social distancing and 54,200 cyclical jobs from base losses. This was a 6.9 percent loss to payrolls. We see a return in 2021 of 140,500 jobs led by 123,700 contact-sensitive jobs joined by only 16,800 from cyclical gains.
This is followed by another 14,200 COVID jobs in early 2022 and 73,200 base/cyclical jobs that continue to be added through this year. Oil jobs will contribute to growth in late 2022 and 2023 and keep cyclical growth running above trend. By 2024 we see payroll growth finally settle back to long-term trends and 1.7 percent annual growth rates.
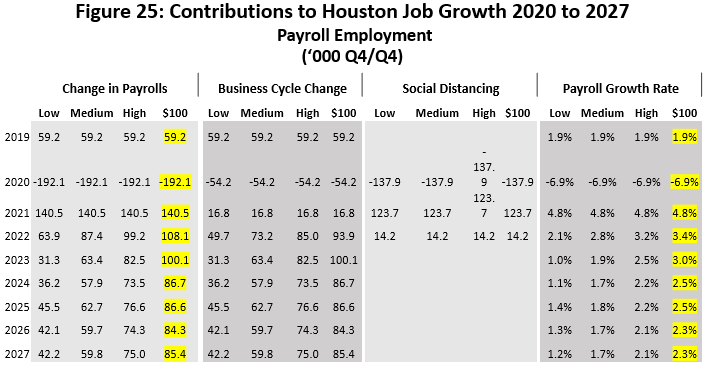
The $100 oil price is highlighted in yellow. As discussed earlier, these numbers depend on a continuous year or more of high oil prices and fracking producers buying into the potential for these prices to stay high. If these conditions were met it could bring 20,700 more jobs to Houston in 2022, and 36,200 more the following year, before settling down finally to around 25,000 more per year in following years. The problem is that these prices above the $65 long-run marginal cost of oil inevitably fall back to $65 or below and imply a future oil bust ahead.
It is important to recognize that the number of returning jobs is exciting with 140,500 jobs last year and perhaps 87,400 jobs this year. But mid-2022 only returns total payrolls to pre-pandemic highs after we will have lost two-plus years of growth to recession and recovery. As stimulus and zero interest rates disappear, this lack of past economic growth will be increasingly exposed.
No matter what happens to oil prices in the near term, the new financial model means that through years to come the new economic expansion will be handicapped compared to the past because of the lackluster performance of oil. If oil is slower, the good news is that the new financial model should make it more stable. The wild gyrations of the industry since 2014 – and its unpredictable economic impacts on Houston – could be behind us for a while.
Written by:
Robert W. “Bill” Gilmer, Ph.D.
Director, Institute for Regional Forecasting
March 27, 2022
University of Houston
C. T. Bauer College of Business
1 The important exception to this (barring the return of all or parts of the Build Back Better program) is $550 billion in spending on traditional infrastructure, but this will arrive slowly (hammer-ready work never arrives in a timely way) and is spread over eight years. It was not paid for through tax revenue and will be stimulative according to the watchdog Congressional Budget Office.
2 From 1992 to 2019 U.S. personal income increased as 4.1 percent per year and real retail and food serve grew 3.0 percent annually. The elasticity of food and retail with respect to personal income is about .73.
3 Houston’s economic base contains upstream oil (producers, services, machinery, and fabricated metals) and downstream oil (refining, chemicals, and plastics). There are also pipelines, non-oil manufacturing, and selected sectors in construction, professional and business services, wholesale trade and air transportation. Calculations use location quotients for excess employment as drawn from a typical textbook. Also see Scott J. Brown, N. Edward Coulson, and Robert F. Engle, “On the Determination of the Regional Base and Regional Multipliers,” Regional Science and Urban Economics,” (1992), vol. 22, pp. 619-635.
4 The figures reflect the recently revised and re-benchmarked data through January from the BLS and Workforce Commission. The revisions marked down base jobs substantially with significant cuts in both to previous post-pandemic gains oil and non-oil base employment.
5 We have produced several earlier reports and presentations with detailed discussion of the recent problems and dilemmas now faced by the U.S. fracking industry, including “Oil Picks Up the Pieces After Economic Shock: Recovery Now Begins for Oil Markets and Houston, Institute for Regional Forecasting, September 2020; and Adriana Fernandez and R.W. Gilmer, “Houston and the Future of American Fracking, March 2021
6 Upstream employment is defined here as producers, oil services, machinery and fabricated metals.