Houston Updates
-
Archive
- June 2025
- March 2025
- December 10, 2024
- September 14, 2024
- May 21, 2024
- March 19, 2024
- December 9, 2023
- June 16, 2023
- April 6, 2023
- March 17, 2023
- Dec. 19, 2022
- Sept. 14, 2022
- July 4, 2022
- March 27, 2022
- March 9, 2022
- September 2021
- April 2021
- March 2021
- September 2020
- August 2020
- June 2020
- April 2020
- March 2020
- January 2020
- December 2018
- June 2018
- March 2018
- February 2018
- January 2018
- September 2017
- September 2017 Post-Hurricane
- June 2017
- March 2017
- January 2017
- September 2016
- March 2016
- December 2015
- September 2015
- June 2015
- March 2015
- December 2014
- June 2014
- March 2014
- November 2013
- September 2013
Harvey in Perspective: The Houston Economy and Hurricanes Past and Present
February 6, 2018
Hurricane Harvey and its flooding raised many questions about its potential effect on the local economy. Harvey was a serious event: It has been classified a 1000-year storm by the Space Science and Engineering Center at the University of Wisconsin, bringing 30 inches of rain or more to areas inhabited by 6 million people, and well over 40 inches in many parts of Houston. High water rescues played for days on national television, many commentators predicted dire consequences for Houston’s recovery from the storm, and some even questioned the region’s economic future.1
The storm raised important issues about the adequacy of Houston’s flood infrastructure, as well as its flood management plans. Over the long-run, Harvey could affect Houston’s perceived desirability for business relocation, how homes are priced across the metropolitan area, or the region’s future development patterns. It is far too early to speculate on these possibilities, partly because much still depends on local leadership’s ability to deliver improved flood control. We need to see the currently-expressed political will to deal with flooding hold up in the face of its high costs.
In this article, I would like to address the more limited question of Hurricane Harvey and the near-term progress of Houston’s economy, drawing on the region’s long history of dealing with major weather events. The conventional wisdom – among economists anyway — is that these storms have a small and short-lived impact on measures of income, employment and production. Eric Strobl, for example, looked at 409 hurricane-prone counties in the U.S. from 1970 to 2005, and found that a hurricane strike produced a significant and immediate loss of economic activity in affected counties, but there was no measurable impact a year later or in any subsequent year. Another study by Guimaraes, et al. of Hurricane Hugo’s impact on South Carolina found that “income gains were neutral overall, despite a major surge in construction, retail, and other sectors.” A study of Florida hurricane impacts by Belasen and Polachek between 1988 and 2005 found that affected counties saw earnings rise and employment fall, but with effects that dissipate over time.2
Figure 1 summarizes our conclusions concerning Houston’s reaction to major storms if their effects are measured six months after the event. For Harvey, the effects are measured only four months after the storm, representing the data we have to date. The first two measures are local payroll employment and the Dallas Fed’s Business Cycle Index (BCI) for Houston; both are broad, economy-wide measures of local economic performance. The effect of the storm is shown only if there is at least a 75 percent chance that the six-month impact is different from zero, taking the gambler’s view that 3:1 odds are always interesting. If the figures are bold, they also meet the 90 percent significance level that science would demand.
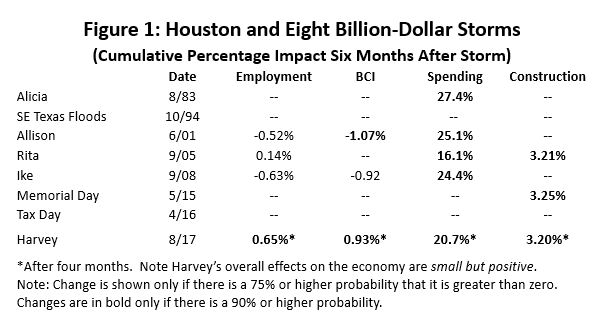
In Figure 1, both employment and the BCI show only small changes. Allison and Ike show small negative changes associated with the storms, while Rita and Harvey are small but positive. Only Allison and Harvey show changes in the broad economy that reach 90 percent levels of statistical significance.
There are specific economic sectors that receive stimulus in the wake of major storms, especially spending and construction activity. Spending in Figure 1 is measured by local sales and use tax collections, and construction activity by employment. Large, significant and positive impacts show up in both sectors. Changes in construction are smaller than expected, and later we discuss why this particular measure may understates storm-related activity.
How can the negative consequences of major storms turn out to be so small, or even be positive? We have to carefully distinguish property damage from on-going measures of economic activity. Moody’s Analytics currently puts Harvey-related damage at about $80 billion, and Houston will no doubt make up a large share of that figure. These damages are a loss of wealth, a regrettable and irreversible loss of capital stock that leaves us all collectively poorer. Whatever the consequences for the economy, no one would advocate a hurricane strike as a means to improve social welfare.3
However, the progress of the economy is measured by the current flow of jobs, income and production. As a storm like Harvey approaches, the population takes shelter and loses several days of work and output, but emerges to find itself in the middle of an intense, if short-lived economic boom in sectors like retail and construction. After several months, recovery activities offset losses in the shelter period. Recovery work then fades to low levels, and the effect of the storm on jobs and income nets out to near zero. Houston’s past storms have all followed these rules, and post-Harvey Houston is on the same well-worn path to rapid recovery.
Severe Weather Events in Houston
Since 1980, according to NOAA’s National Weather Centers for Environmental Information, Houston has been affected by eight severe weather events that left behind a billion dollars or more in damages. These loss figures are in 2016 dollars, and are adjusted for changes in price levels over time by using the Consumer Price Index. Houston events are a mix of severe floods, tropical storms, and hurricanes. The tropical events can bring high winds and storm surge, as well flooding in streets and along regional waterways.4
- Alicia ($7.5 billion in damages) was a Category 3 hurricane that made landfall near Galveston in August 2003 with 115 mile per hour winds and a 12-foot storm surge. A slow-moving storm that allowed a long period of shelter and preparation, it caused widespread damage throughout the metropolitan area.
- The October 1994 Southeast Texas Floods ($1.7 billion) formed partly from the remnants of Pacific Coast Hurricane Rosa, as well as from favorable conditions in the Gulf of Mexico. The result was four days of vigorous thunderstorms and torrential local rains of 8-28 inches. The heaviest downpours were on the East and West Forks of the San Jacinto River, Lake Livingston, and along Spring Creek.
- Tropical Storm Allison ($11.9 billion) landed at Galveston in June 2001, coming ashore with high rates of rainfall but moderate winds and surge. There was no significant shelter period. Allison then traveled north into east Texas, turned around, and headed back into the Gulf of Mexico. It was this second visit to Houston that brought major flooding of 30-40 inches across the Houston region.
- Hurricane Rita ($23.9 billion) in September 2005 recorded the third lowest barometric pressure of any Atlantic storm, and its size and potential strength prompted extensive preparation and widespread evacuations from the heavily-populated Houston metro area. The storm made landfall east of Houston at Sabine Pass, resulting in little or no damages to the Houston region and no recovery period.
- Hurricane Ike ($34.8 billion) was the largest storm (by size) to ever enter the Gulf of Mexico, and it landed at Galveston as a strong Category 2 hurricane in September 2008. Its storm surge overcame the Galveston seawall, and left near total destruction across much of the island. Damage was widespread throughout Houston’s metropolitan area, and in many cases electrical outages took weeks to repair.
- The Memorial Day Floods ($2.6 billion) of May 2015 resulted from a slow moving storm system that moved across widespread areas of Texas and Oklahoma, bringing torrential rains and flooding. Heavy rains in Houston resulted in hundreds of high-water rescues.
- The Tax Day Floods ($2.8 billion) of April 2016 resulted from another multi-state outbreak of thunderstorms. Up to 17 inches of rain fell over much of the City of Houston and its suburbs, again prompting many high-water rescues.
- Hurricane Harvey (about $80 billion) was a Category 4 storm that made landfall in August 2017 well to the west of Houston at Rockport, resulting in little local wind or storm surge. For Houston, devastation resulted from heavy rainfall, with more than 6 million residents living in areas that received 30 inches of rain or more. Harvey’s rains have been declared a thousand-year storm by the Space Science and Engineering Center at the University of Wisconsin, with no apparent precedent in the history of North America.
In thinking about how these weather events affected the local economy, it is useful to use the classification scheme in Figure 2. First, hurricanes like Alicia and Ike follow a pattern that begins with evacuation or shelter in place, with many workers losing several days of employment or income. The population emerges from shelter to find a boom in retail sales and construction as immediate repairs are made. This is followed by several months of retail sales, construction, and recovery-related activities that may run at higher-than-normal levels. Hurricanes tend to leave a distinctive down- and up-pattern in the economic data on employment and income.
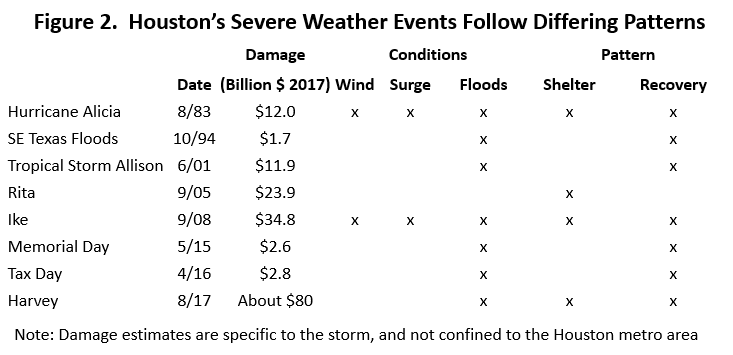
The flood events, in contrast, take the population relatively unaware, as the city is caught by a period of intense thunderstorms and heavy rain. There is not usually a period where economic activity stops in the face of pending disaster, and workday routine often can resume more quickly after these flood events than for hurricanes. For example, fresh water flooding follows much more predictable and localized channels than wind or storm surge, leaving untouched most roadways, electrical lines and other infrastructure in a metro area as large as Houston. The 1994 Floods, the Memorial Day, and Tax Day events all follow this flooding pattern. The surprise from these storms is usually their ability to reach beyond previously-established and expected flood plains.
There are also three hybrid events listed. Tropical Storm Allison, for example, came ashore with high rates of rainfall but no shelter period, and only moderate winds and surge. The National Hurricane Center had stopped issuing bulletins on Allison as it traveled north as far as Lufkin, but a return visit to Houston brought major floods. We have a tropical event that had economic impact more like a flood event: no prior warning or shelter period, no surge, no wind, and damage mostly from fresh water.
In contrast, Rita brought significant preparation and shelter-related activities throughout the Houston metro area, but landfall came just east of Houston with little local damage and no real recovery period. Hurricane Harvey also required Houstonians to take shelter as it approached the coast, and – like Rita – it missed the region at landfall. Unlike Rita, however, Harvey landed to the west, bringing the dirty side of the storm to Houston. There were no local hurricane-force winds or storm surge, and Harvey left its mark with regional flooding.
Storms and the Economy: The Harvey Example
Without minimizing the individual suffering or property losses that Harvey inflicted, moving our perspective to the collective level of Houston’s 6.7 million people and 3 million workers puts these major storms into a very different context. Regional economists often distinguish basic and non-basic industries. Basic industries are those that drive the local economy: they export their output from the region to the rest of the state, nation, or the world, and they bring income and local job growth. Obviously, oil is a big component of the economic base in Houston, but so are many local companies that sell into national markets, like United Airlines, AIG, Sysco, HP, or Waste Management.
In contrast, non-basic business sells directly to the community, providing inherently local services like grocery stores, drug stores, laundries or dry cleaners. These businesses will be found in or near residential neighborhoods, widely spread through the city for the convenience of their customers. They react to the economy, and do not drive regional growth.
Houston’s economic base is often described as a four-legged stool: upstream oil production and oil services; downstream refining and petrochemicals; some patient care and the research and education activities at the Texas Medical Center; and the Johnson Space Center and its contractors. This base activity – the driver of local economic activity — was never seriously challenged by Harvey.
First, much of the local economic base is office-based work in exploration and production, medical services, and aerospace. Houston’s oil production and services activities, for example, are engineering and technical services for a global industry, and mostly carried out in office towers in west Houston. Oil expertise is a legacy from Spindletop in 1900, but today you find very few rigs at work in modern Houston. The main disruption to these activities was not flooding of the workplace, but just the temporary inability of workers to move around the city, and to get to work.
We know from survey work by CBRE that only 46 of Houston’s 1,200 non-owner occupied office buildings were affected by Harvey, collectively having 11.6 million square feet, or 4.4 percent of the market. Half those buildings were operational soon after Harvey, and another quarter operational at year-end. Additional space needs that arose from any owner-occupied damages were quickly filled by 44 million square feet for lease or sublease in Houston.
Most medical activity in Houston is non-basic, no different from the services of personal physicians and hospitals provided in every large U.S. metro area. Houston’s medical export base is the roughly 10 percent of the patients at the Texas Medical Center that are referred to Houston from elsewhere, plus the TMC’s extensive research and educational activities. Again this work is conducted in hospitals, laboratories, classrooms, and offices, and disruption is from the lack of employee mobility.
Harvey-related damage at the Texas Medical Center was small, allowing a quick resumption of normal services. The TMC had earlier learned difficult lessons from heavy damages sustained in Tropical Storm Allison, and Harvey showed how well prepared they are today. Limited damage also applies to the operations at the Johnson Space Center, to JSC’s technical and research activities, as well as to the work of its contractors.
One source of disruption could have been oil-related machinery and fabricated metals. Historically located along the old machine-shop row on Hardy Street, the industry spreads through northeast Houston and into a number of flood-prone areas. Harvey could have had adverse consequences for the oil industry if it had severely disrupted the supply chain for drilling and oil services. We don’t know much about specific damages, but the industry is depressed due to low oil prices, and has substantial overcapacity. There have been no supply-chain issues.
Finally, the Ship Channel industries were never seriously threatened by Harvey. Initially, few plans were made to shut these plants as Harvey moved west of Houston. But then (1) Harvey backed into the Gulf and threatened a second landfall, and (2) plant management realized that rising high water left employees stranded by high water across the city and emergency services unable to respond.
Hurricanes Katrina, Rita and Ike did substantial damage to the nation’s refining and chemical industries with high water from storm surge, but Harvey posed no threat of surge to Houston. The months-long refinery closings on the Mississippi River following Katrina, for example, were the result of surge reaching the plants’ electric motors and control systems. This time, Ship Channel industries made a relatively routine shutdown and restart of the kind that can come with any passing storm.
In retrospect, Harvey’s floods did not threaten the key workings of the Houston economy, and there was little reason to think business activity would not normalize quickly. A different storm could have exposed weakness in Houston’s manufacturing base – machinery, fabricated metal, refining and chemicals – but the region dodged all bullets this time.
Storms versus the Business Cycle
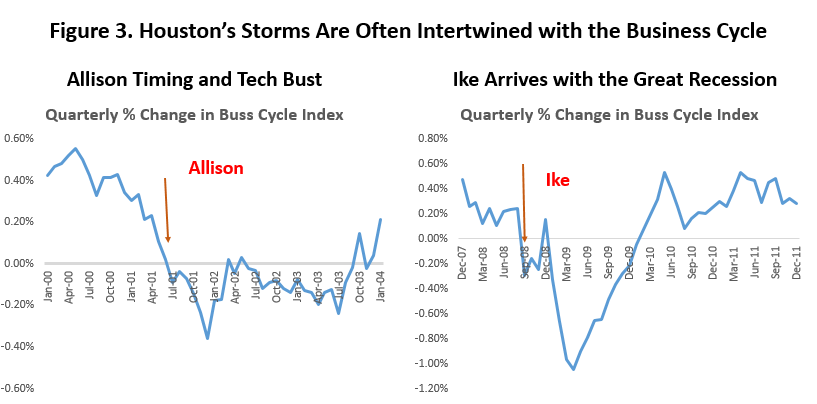
To understand the economic effects of severe weather on the local area, we must put aside the business cycle. This is certainly the case for Houston, where storms have several times hit at critical junctures in the cycle.5 Figure 3 shows the timing of Allison and Ike, for example, with respect to local cyclical developments; both arrived just as Houston was weakening and about to fall into recession. The chart shows the quarterly growth rate of local payroll employment, and the arrows indicate the timing of the storms. It is easy to see how careless commentators could view these charts and attribute large, negative, and long-lived economic effects to these major storms.
Here is a summary of the arrival time of each of our eight storms relative to Houston’s position with respect to the national and local business cycle.
- Hurricane Alicia (8/83) hit Houston just after the U.S. economy emerged from the deep 1982 recession in the previous November. While Houston did not share the 1982 U.S. recession, that same November the region fell into the 1980s oil bust. By the time of Alicia’s landfall, the local economy was contracting rapidly.
- The Southeast Texas floods (10/94) came during a period of steady expansion in both the U.S. economy and Houston.
- Tropical Storm Allison (6/01) arrived during the 2001 U.S. recession associated with the Tech Bust, and its landfall marked the first month in which Houston shared the recession. The Enron scandal would not affect the region until the following October.
- Hurricane Rita (9/05) landed at Sabine Pass during a period of long and steady expansion in both the U.S. and Houston. However, it was a busy time. That fall, the national economy was shaken by the end of the subprime housing boom. And the date coincides with two unrelated local events that could positively affect spending: the Hurricane Katrina evacuation of thousands of refugees into Houston from New Orleans, as well as an October World Series.
- Hurricane Ike (9/08) came eight months after the beginning of the Great Recession in the U.S., but Houston only followed after the collapse in the global economy and oil prices. Ike marked one of the early months in which Houston had finally entered the recession.
- The Memorial Day Floods (05/15) occurred during the early stages of the Fracking Bust, and were accompanied by continuing losses of oil-related jobs that would ultimately total 77,000. The economy as a whole was weak, with little or no overall growth through 2015.
- The Tax Day Floods (4/16) also came during the Fracking Bust, with oil-prices crashing and the number of drilling rigs in the U.S. falling to the lowest levels recorded by Baker Hughes since their first count in 1947. This was the capitulation phase of the latest drilling bust, and Houston may have entered a mild recession at this time.6
- Harvey (8/17) made landfall just as Houston was emerging from the Fracking Bust, and a weak to moderate economic recovery was underway.
Adjusting for the Business Cycle
We have adjusted for the business cycle by estimating a monthly autoregressive distributed lag (ARDL) model of the Houston economy, assuming that growth in total local payroll employment responds to trends in the U.S. economy, and to changes in local upstream jobs. Little oil is produced within the Houston metro area today, but it is a global engineering and technical center. At its most recent peak in 2014, there were 240,000 local jobs engaged in oil production, oil services, fabricated metal, and machinery. Apart from the U.S. economy, oil and natural gas drilling activity is the most important factor moving Houston’s business cycle. Oil regularly sets the area on a cyclical path different from the U.S. — sometimes for the better, and sometimes not.7
How do we measure the economic effect of storms? For each storm we have created a series of dummy variables, one dummy for each month of a storm’s potential impact over six months. For hurricanes like Ike and Alicia, the first dummy indicates the month of shelter, the second is the month of bounce-back, and then one for each of four subsequent months. For other storms, the first two months are less predictable. These variables tell us, given the prevailing business cycle conditions at the time, the impact of the storm on the local economy on a month-by-month basis. After examining the residuals in the data to be sure that six months is enough time to capture storm-related impacts, the combined monthly coefficients tell us the percentage impact of the storm on total employment or spending over the period.8
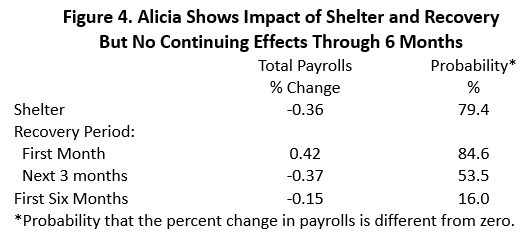
For example, Figure 4 below shows the estimated impact of Hurricane Alicia in 1983 on jobs. The initial shelter month resulted in a decline of 0.36% in payroll jobs, many of them likely to be hourly workers in retail, food service, or entertainment. There was a quick return of these workers the following month, with a jump in payrolls of 0.42%. There is a near-80 percent chance that each of these changes was more than random chance. Over the subsequent 3 months there is a decline in payrolls of 0.37 percent, but only roughly a 50-50 chance it is meaningful. There is no significant 6-month change.
The conclusion from Alicia is that there can be meaningful changes in employment – plus or minus — associated with the storm, but they net to near zero after six months. While there is no doubt a long period of low-level, storm-related spending and construction that continues for many more months, it is not enough to move the economic needle in a metropolitan area with millions of workers. Houston had 1.4 million workers on payrolls in 1983, and 3.0 million today. After several months, the economic impact of Alicia was largely gone, if not forgotten.
For flood events, there is no shelter period and the first month is the storm’s immediate impact; this is then followed by months that may show higher levels of spending and more construction. The arrival date of the storm can affect the outcome, depending on whether it is early or late in the month. For example, Figure 5 shows the estimated impact of the 1994 Floods, with an immediate but small 0.03 impact on payrolls in the storm month.9 We can be only 64.0 percent sure that this is a meaningful change. The next four months show continued small, positive effects that add up to 0.28% change, and eventually over six months they add up to a positive .03 percent that has a 77.3% probability of being greater than zero. The main point: the change is small and positive.
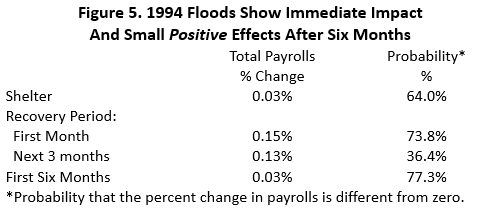
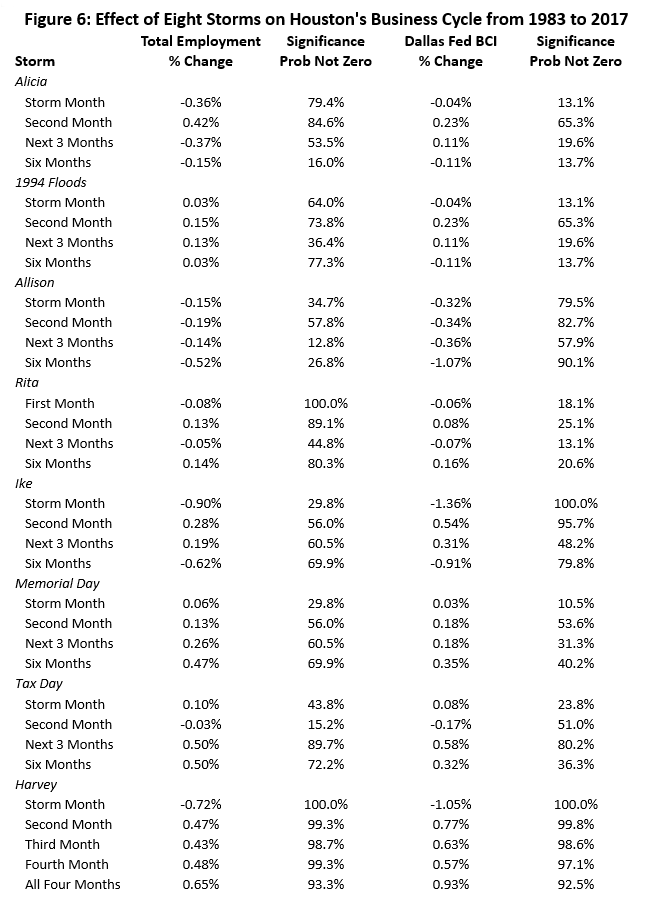
Figure 6 summarizes the results for payroll employment in all eight weather events. We have also used another, broader measure of Houston’s economic performance, the Dallas Fed’s Business Cycle Index (BCI) to look at the effect of the storms on the economy. The BCI is a weighted average of four variables specifically chosen to track Houston’s economy; payroll employment is still the most important factor, but the index also includes the unemployment rate, real retail sales, and real wages.10
Figure 6 also shows for each storm the percentage change in employment or the BCI for the storm month, the following month, the next three months, and for the six month period beginning with the storm month. The results show that over six months, and based on either measure, the largest changes are associated with Allison, Ike, and Harvey. Allison and Ike show small negative changes, and Harvey has small positive changes. Harvey is measured only over the first four months of the storm, and it shows a high probability in excess of ninety percent that its impact has been positive and highly significant. However, neither payroll jobs nor the BCI moved more than one percent.
For these purposes, we again put aside the 90 or 95 percent significance level that science often demands, and accept the gamblers view that 3 to 1 odds could make a pretty good bet, i.e., anything at 75 percent significance or more is worthy of notice.
- Alicia shares with Ike and Harvey the hurricane’s hallmark, a strong shelter-driven decline followed by quick recovery once the storm passes. However, over the six-month period, payroll employment and the BCI net out to no meaningful change.
- The 1994 Floods show small immediate impact on employment, but persistent increases that carry through to a positive increase of 0.03% over six months. The BCI, as a broader measure, simply shows no impact.
- Tropical Storm Allison has negative employment impacts in both the first and second months, and they continue to cumulate. Over six months there is small chance of a 0.52 percent loss of employment. The broader BCI , however, is more certain of losses to Allison, and over six months they add to a 90.1 percent chance of a 1.07 percent fall in the BCI.
- Hurricane Rita’s only effect on Houston was a major dislocation of the population as the storm approached. No sign of evacuation or the shelter period appears in the first or second month for either jobs or the BCI, but for employment there is an 80.3 percent chance of a 0.14 percent gain. We will discuss this further below, but this figure more likely reflects the relocation of refugees from New Orleans after Katrina than any local effects of Rita.
- Hurricane Ike has the expected initial down/up hurricane pattern. Over six months the storm results in net job losses associated with the storm of 0.62 percent, and a decline in the BCI of 0.91 percent.
- The 2015 Memorial Day Floods show persistent gains in employment and the BCI through the period, but they never add up to statistically meaningful changes.
- The 2016 Tax Day Floods follow the lead of the Memorial Day event, with no significant changes over six months.
- For Harvey, both payroll employment and the BCI show a significant decline in the shelter month, followed by a strong bounce-back. Over the first four months of recovery, both measures show strong positive gains that are significant.
Harvey joins Allison, and Ike as storms that show a capacity to move the economy over a period as long as six months. The important result, however, is that the net economic impact of all storms is small, can be positive or negative, and doesn’t last long. The 6-month employment changes for these storms add up to a percentage point or less.
Spending
There are two sectors of the economy where we would expect to see big gains after a destructive weather event: spending and construction. Household and business spending replaces goods or repairs structures damaged by the storms: autos, carpets, furniture, clothing, wallboard, roofing materials, etc. Construction workers are needed to carry out the repair and replacement of single-family homes, apartments, office buildings, businesses, and industrial buildings. We would expect to see immediate and large increases following the storm, but tapering off quickly as the most urgent repairs are made.
To measure retail and business spending, we used the Texas sales and use tax allocations received monthly by the City of Houston. The City levies a one-cent sales and use tax that is paid by merchants to the Texas Comptroller, the collector of all state and local sales taxes. The tax liability is incurred in month 1; funds are collected by the Comptroller in month 2; and in month 3 the tax revenues are paid to local authorities such as cities, counties and transit authorities.11 These allocations reflect household spending on retail items and many consumer services, but also include use taxes paid by business. In short, use taxes are levied on business spending for tangible goods that are not passed on to the next stage of production, and use taxes fall heavily on capital goods. Storm damages should cause spending for the repair and replacement of business capital to surge.
City allocations were moved to the month in which the tax liability was incurred, converted to constant 2016 dollars, and adjusted for seasonal variation. We accounted for business cycle conditions by assuming that sales tax liabilities follow total payroll employment, and again use a series of dummy variables to account for each storm.12 Other corrections were necessary to account for the City of Houston’s use of limited partial annexations to push its tax collection authority beyond its statutory city limits.
Figure 7 reports the spending associated with each storm, using the same format as Figure 6. Again, percentage changes are shown for the storm month, the following month, the next three months, and the six-month period. The probability that each change is different from zero is also reported.
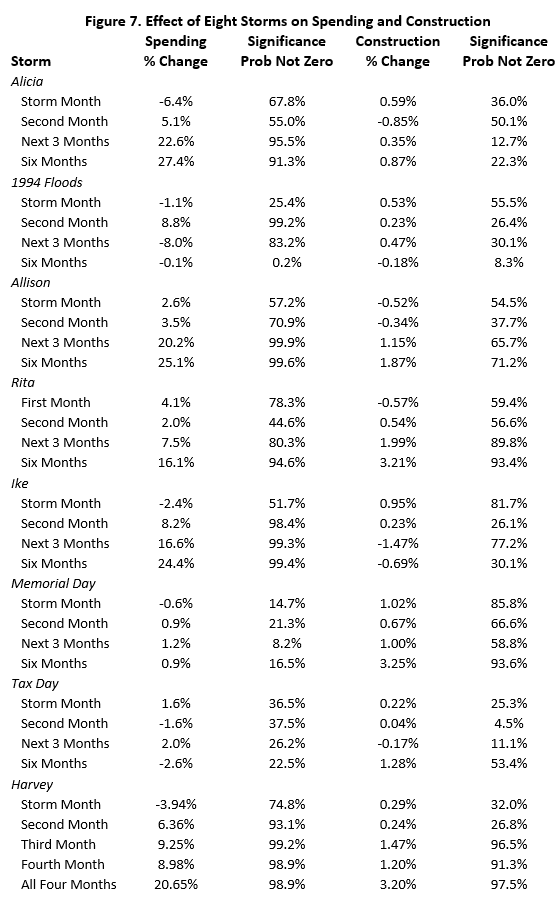
The results are not surprising: big storms generate major damages that spur high levels of spending. Alicia, Allison Ike, and now Harvey stand at the top of our list in percentage increases in spending. Stated in 2016 dollars and based on the City’s one percent tax rate, our estimates imply that Alicia generated an additional $606.1 million in storm-related taxable spending, while Allison and Ike resulted in increases of $717.5 million and $981.3 million, respectively. After four months, Harvey has generated $1.04 billion in taxable sales, and if Allison or Ike is a guide to what comes next, we expect that coming months Harvey may see continued higher than normal spending, but the bulk of this activity is behind us.
The big taxable sales increases associated with Rita should be ignored to the extent they are probably unrelated to the storm. Rita showed limited direct impact on the economy in Figure 6, and these spending increases are more likely related to the influx into Houston of thousands of Hurricane Katrina refugees, and perhaps the 2005 baseball playoffs and 2005 World Series.13 The 1994 Floods show an initial burst of spending, but the impact is gone after six months. Spending associated with other, more localized storms, like the Tax Day and Memorial Day Floods does not show any meaningful change.
Construction
Similar calculations for the effect of storms on construction employment are shown in Figure 7. The results for total construction do not show the large and unequivocal increases we might expect. Alicia, Ike, the 1994 Floods, Allison, and the Tax Day Flood show no significant construction impact. Rita is significant, but again for the wrong reason. Rita came ashore just as the subprime construction boom was peaking, and Houston was a significant participant in the housing bubble; Rita’s big construction numbers almost certainly should be attributed to housing.14 Ike shows a significant pick-up in construction activity over a couple of months only. The Memorial Day Floods stirred construction increases, but not the Tax Day Floods. Harvey is now showing a 3.2% increase over four months that is highly significant.
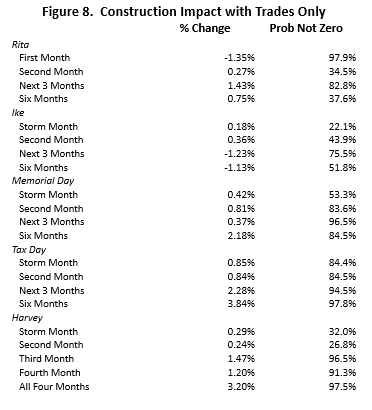
As an alternative measure, we turned to construction employment in the trades only: painters, plumbers, roofers, carpenters, electricians, etc. These results are shown in Figure 8. Unfortunately, this data is available for Houston only since 2005, meaning there is no specific information on Alicia, the 1994 Floods, or Allison. The results for Rita and Hurricane Ike are little changed from the impact already seen for total construction. But now both the Memorial Day and Tax Day Floods show meaningful construction effects, and Harvey still comes in with large and significant gains over four months.
The results for these trades fall only a little more into line with expectations, but there are reasons to think that any fault may lie with our measure rather than the event itself. Construction employment measure may miss a big part of the jobs associated with repair, and storm-specific effects are possibly much bigger than indicated by Table 7 or 8.
- Substantial repair and remediation work will be done by national contractors, many specializing in flood damages, and often under contingency contracts with local building owners. They may specialize by building-type, e.g., in office or apartment remediation, or specialize in drying out large areas, delivery of large commercial emergency generators, elevator and electrical system repair, or general flood clean up. They are disaster specialists moving from one storm to the next, and will typically not show up on local payrolls.
- Much of the clean-up work is unskilled labor: mucking out flooded buildings, removing damaged furnishings, tearing out carpeting, cutting out wallboard, or tearing off damaged roofs. These workers are often day labor recruited off the streets, and much of the work is done off the books. Even if it is on the books, the workers are unlikely to appear in a monthly BLS sample of construction sites.
- Local skilled construction workers are also tempted to go off the books in the chaotic conditions left by a large storm. Further, in a slack national construction market, available work and temporary high wages in Houston will draw skilled construction workers from across the country. For local and nonlocal workers, non-taxed temporary high wages are better than having them taxed — and in many cases they will they not show up in any official count.
- Finally storm-related activity will displace other construction work that otherwise would have happened. Storm disruption, labor shortages, and high wages will push some planned construction activity into the future. The price of deferring the projects is yet another uncounted cost of the storm.
Conclusions
We examined eight severe weather events that caused at least a billion dollars in damages since 1983, and found limited effects on the Houston economy. Using two measures of how the economy responded, and a reduced level of statistical significance, Tropical Storm Allison and Hurricane Ike might have driven statistically meaningful and negative changes over a period as long as six months, but these changes are small — one percent or less. In contrast, Hurricanes Rita and Harvey show small, statistically meaningful, and positive increases in employment. This result is in general agreement with a wide range of similar economic studies.
Unlike some past storms, Harvey never posed a threat to Houston’s economic base. Other storms have forced longer closings of the Port, brought much greater damage and disruption to the Ship Channel industries, and severely damaged the Texas Medical Center. That was not the case this time, and business activity has normalized very quickly.
The focus on Harvey’s impact should be as a serious blow to local single-family housing, and particularly to homes built before new construction standards were imposed after Tropical Storm Allison. Post-Allison homes saw much less damage, and new home developments in Houston saw very little damage. Small businesses hurt by the storm are mostly collateral damage to housing. These businesses generally match the non-basic activity described earlier, i.e., grocery stores, dry cleaners, restaurants, and retail shops, or activities that locate in residential neighborhoods for the convenience of their customers.
There are exceptions to this rule that regional economies escape severe storms with only limited consequences: New Orleans and Katrina, Puerto Rico and the on-going flight of population to the mainland following Hurricane Maria, the failure of Galveston to return as an important Texas city after the 1900 storm, or the major Texas port of Indianola that was simply abandoned after hurricanes repeatedly struck in 1869, 1874, 1875 and 1886. However, the vulnerability of infrastructure in these locations – a metro area built below sea level, a badly neglected electricity system, a city located on a barrier island, or a lingering dispute over who should pay to upgrade infrastructure — suggests that these may be exceptions that prove the rule.
In each case, the extent of the storm-related damage was greatly magnified by failure to take action in the face of well-understood infrastructure problems: New Orleans and its dikes, the electrical system in Puerto Rico, and both Galveston and Indianola failing to alter highly exposed locations despite repeated warnings. Indianola was simply abandoned in 1886. Galveston finally did react after the 1900 storm, raising the city and building a seawall that would make it safe for another century. But the action came too late, and the perceived risk of major investments in Galveston became the catalyst that transformed Houston into the greatest city on the Gulf Coast.
Perhaps Houston now has had its warnings about infrastructure, and it is time to act before large and lasting damage is done. Hurricane Ike in 2008 exposed Houston’s coastal areas to unprecedented storm surge, overcoming the Galveston Seawall, and once more leaving storm-driven devastation across the island. Despite much discussion since Ike, and many proposals to protect Houston’s highly-developed coastal areas and the Ship Channel, little has happened so far.
Now Harvey has taught us that the storm-related flood threat from Houston’s bayous and rivers is possibly far greater than we previously realized. We now know there are real short-comings in local flood infrastructure and management. Houston’s test — if it is to avoid being the next New Orleans or San Juan – is to restore the balance between the high cost of flood control and potential storm-related losses. Then we must find the political will to implement the plan.
Appendix A: Estimation of Business Cycle Effects
The autoregressive distributed lag (ARDL) and error correction model was developed by Engle and Granger (1987), and is a staple in modern econometric textbooks, e.g., Enders (2010). We assume general familiarity with the approach. As discussed in the body of the paper, business-cycle developments in Houston were modeled using these method, and employed as a means to isolate the economic effects of storms apart from the business cycle.
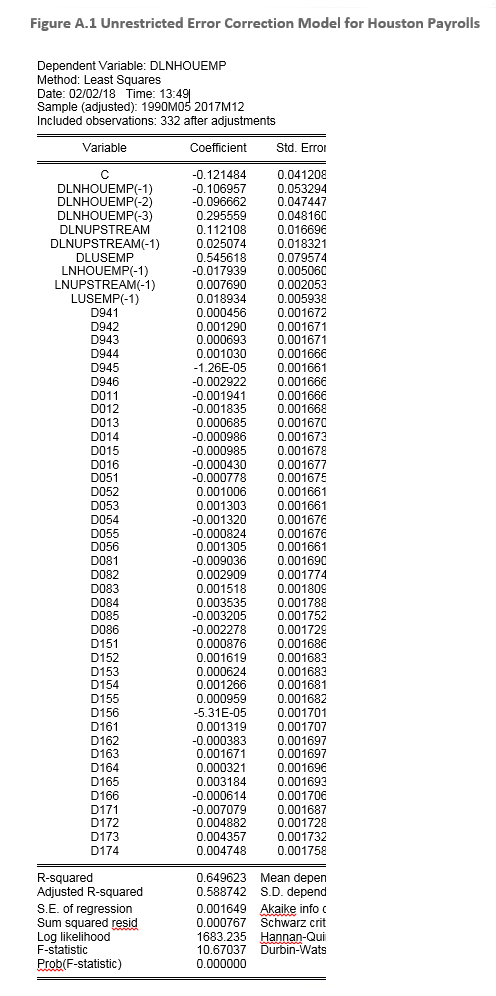
Figure A.1 shows the ARDL model estimated with ordinary least squares, and in an unrestricted error correction form.15 Data are monthly from 1990 to 2017. The dependent variable is the first difference of the logs of Houston employment, and explanatory variables are the logs of Houston’s upstream employment and U.S. employment, as well as their first differences. We have three autoregressive lags, and one lag for log differences in upstream employment. The log differences are interpreted as monthly growth rates. The Lagrange Multiplier test for autocorrelation indicates no significant problems for testing coefficients. Upstream employment is defined as the sum of oil production, oil services, machinery and fabricated metals.
The logs of the variables are included and lagged once. This is the error correction part of the model, where the difference -c1*lnhouemp(-1) + c2*lnupstream(-1) + c3*lusemp(-1) measures the previous residual in the estimation process, and the c’s are estimated coefficients. It is assumed that there is a systematic adjustment process at work to eliminate large residuals, it can be estimated, and the negative coefficient on lnhouemp(-1) is a necessary condition. Because we have mixed levels and differences in the equation, bounds testing must be used for coefficient significance tests (Peseran, et al.), and the Bounds F-test indicates that the correction process is indeed at work. There is cointegration and a strong long-term relationship among the variables.
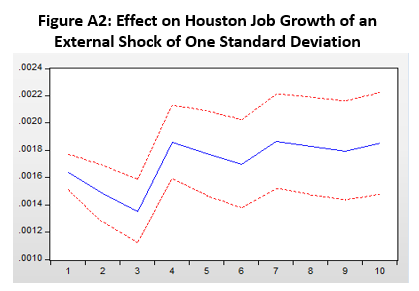
The long-term relationship in the model: a one percent change in upstream employment results in a (c2/c1) = .43 percent change in total payroll employment, while a one percent change in U.S. employment will deliver a (c3/c1) = 1.06 percent increase. The error correction coefficient that seems small, indicating an rather long (1/c1) = 56 month correction period. As a practical matter, however, Figure A.2 shows that virtually all of the correction process – and the move from short- to long-run results — works out over four to six months.
The model was re-estimated over the period 1970 to 1999, using data from the Standard Industrial Classification (SIC) Code which was replaced by the NAICS in 2002. Estimation stopped at 1999 because the last few years of SIC data were never properly re-benchmarked and revised. Results are virtually identical to the previous NAICS estimates for 1990 to 2017. The specification for SIC data was the same as the NAICS equation; there was a negative test for autocorrelation; a strong long-term relationship exists where (c2/c1) = .40 and (c3/c1) = 1.15, and an adjustment period of three to six months. This SIC data allowed us to estimate the impact of Alicia in 1983 and provided a second estimate for the 1994 Floods. The 1994 estimates were very similar for both SIC and NAICS, and only the NAICS estimates are shown in Table 5.
The dummy variables measure the impact of the storm as the percentage change in employment or the BCI caused by the storm in that month. The dummy coefficient can be interpreted as follows: a fitted value of Houston employment is computed based on current conditions in the U.S. economy and oil markets, and all of the difference between measured and fitted employment in that month is attributed to the storm. Alternatively, think of forcing the estimated monthly residual to zero by virtue of including the dummy. It is important to include the dummies in the model, because we do not want the error-correction process responding to one-time events like floods or hurricanes.
Spending and construction estimates used a similar approach, with the main difference being that tax revenue and construction employment were assumed to react to changes in Houston’s payroll employment. The same error correction process was assumed, and the results were consistent with stable long-term relationships. SIC- and NAIC-based estimates were combined to get a complete history of floods and hurricanes after 1983.
Enders, W. (2010) Applied Econometric Time Series (New York: Wiley), 405-409.
Engle, R. F. and Granger, C. W. (1987). Co-integration and Error Correction: Representation, Estimation, and Testing. Econometrica: Journal of the Econometric Society, 55:251—276.
Pesaran, M. H., Shin, Y., and Smith, R. J. (2001). Bounds Testing Approaches to the Analysis of Level Relationships. Journal of Applied Econometrics, 16:289—326.
Written by:
Robert W. Gilmer, Ph.D.
Institute for Regional Forecasting
February 6, 2018
1AccuWeather predicted $190 billion in losses, and that the “floodwaters and lack of electricity and basic services puts Houston into third world-like conditions for days or weeks to come.” In fact, about 100,000 homes were affected by the storm, but two-thirds of them were classified as quickly habitable with minor repair. Only about 1.3 percent of the metro area housing stock sustained major damage or was destroyed. Because there was little wind associated with the storm in Houston, at the worst moments for the electrical system, 95 percent of Houstonians had electricity. A small television screen relaying events over a long distance can produce major distortions in perspective.
2.” Eric Strobl, (2011) “The Economic Growth Impact of Hurricanes: Evidence from U.S. Coastal Counties,” Review of Economic Statistics 93:575-89; Paulo, Giimaraes, Frank L. Hefner, and Douglas P. Woodward (1993) “Wealth and Income Effects of Natural Disasters: An Econometric Analysis of Hurricane Hugo,” Review of Regional Studies 23: 97-114; Ariel R. Belasen and Solomon W. Polachek, (2009) “How Disasters Affect labor Markets: The Effects of Hurricanes in Florida,” The Journal of Human Resources 44: 251-76.
3Bastiat’s broken window fallacy is often cited in these cases: a window is broken accidentally, and a worker is hired and paid to fix it. Employment and income rise as a result. Are we better off? You have to weigh the property losses on the homeowner’s balance sheet against the worker’s gains on the income statement. Frederic Bastiat, (1850) “That Which Is Seen and That Which is Not Seen,” http://bastiat.org/en/twisatwins.html
4The list of storms and designation of constant-dollar storm damages is from NOAA National Centers for Environmental Information, “Billion Dollar Weather and Climate Disasters: Table of Events,” https://www.ncdc.noaa.gov/billions/events/US/1980-2017. Also the description of storms draws on David Roth, “Texas Hurricane History,” Camp Springs, Maryland: National Weather Service, 2009 and Fred Liscum and Jeffery W. East, “Floods in Southeast Texas, October, 1994, U.S. Department of the Interior, U.S. Geological Survey, January 1995. Damage values are for all areas affected by the storm, and are not necessarily specific to Houston.
5The U.S. business cycle dates are taken from the National Bureau of Economic Research at http://www.nber.org/cycles.html. The Houston dates are from the Houston Business Cycle Index compiled by the Federal Reserve Bank of Dallas, at https://www.dallasfed.org/en/research/econdata/mbci.aspx
6This is based on the Dallas Federal Reserve’s Business Cycle Index, just cited, and which is discussed at length later in the report. The BCI shows a decline of about 2 percent in 2016, which would be the mildest local recession since the 1970s, if it should count as a recession at all.
7We will leave the details of the monthly model to an appendix. However, it has good statistical properties: log differences of the key variables are stationary and strongly correlated; there are no issues with autocorrelation and coefficient tests; and there is strong evidence of cointegration and stable long-run relationships among key variables. Return to equilibrium after an external shock to Houston’s economy is complete in 4 to 6 months, and ultimately a one percent change in U.S. job growth will move Houston’s total payroll employment in the same direction by 1.1 percent, and a 1.0 percent change in oil-related jobs will move payrolls 0.4 percent. In its error-correction form, the two key variables explain about two-thirds of the monthly changes in Houston’s payrolls.
8Because the model is estimated in log differences, the interpretation of the coefficients on the dummies is a percentage change during the period, and as a share of the month before the count begins. For example, for the six-month change in activity, if m0 is the month before the storm, and m1 to m6 are subsequent months, the total percentage change is:
m6/m0 = (m1/m0)(m2/m1)(m3/m2)(m4/m3)(m5/m4)(m6/m5)
The total change in employment or spending is found by multiplying the percentage change by m0.
9The storm data have been adjusted to reflect the right reporting month for the effects of the storm. Payroll employment is reported for the pay period that contains the 12th day of each month. If the storm had hit on June 1, the “first month” would be June. However, since Allison’s floods, for example, occurred from June 15-19, the initial employment effects are reported in July. Spending and tax revenue collections, in contrast, began immediately in June.
10See the description at https://www.dallasfed.org/research/econdata/mbci.aspx
11METRO MTA has a nearly identical one-cent sales tax, the main difference being that it is collected in other regional cities beyond the limits of the City of Houston. The METRO monthly data is not available for a decade from 1987 to 1997, but for those periods and storms where we could estimate, spending results are very similar to those for the City.
12For spending purposes, it was necessary to also use dummy variables for other major events that can move spending sharply in a short period: Y2K, the 2004 and 2017 Super Bowl, the 2005 World Series, and other sporting events. These factors don’t move the economy as a whole, i.e., are not significant in calculations of Table 6, but matter only for local spending in Table 7.
13We have the World Series problem in October 2005 and again in 2017, with related spending mixed in with the spending impact of Rita and Harvey. The question is whether the World Series matters? Unlike the Super Bowl or Final Four, the location of the World Series is only determined in the last few days of the season, and relatively few of the attendees are from outside the city. This means much of the World Series spending is simply diverted from other local entertainment venues, and the net increase in local spending associated with the Series should be small. That is how this spending be treated in a good economic impact study. The playoffs and World Series deserve mention, but may not be an issue in measuring storm-related spending.
14Houston builders generally used subprime funds to develop small lots and build low-cost starter homes. These were small developments, often in sketchy neighborhoods. Homes were sold to otherwise unqualified buyers, or to out-of-state purchasers as rental properties.
15The model shown here is an unrestricted OLS estimate, and the dummy coefficient estimates shown in Tables 6 and 7 above are from a slightly different restricted version of the model. Dummy coefficients differ only in small ways between the two models. The unrestricted model makes a better example, as it uses the more familiar OLS estimates, and it better displays the workings of the error correction process.