Houston Updates
-
Archive
- June 2025
- March 2025
- December 10, 2024
- September 14, 2024
- May 21, 2024
- March 19, 2024
- December 9, 2023
- June 16, 2023
- April 6, 2023
- March 17, 2023
- Dec. 19, 2022
- Sept. 14, 2022
- July 4, 2022
- March 27, 2022
- March 9, 2022
- September 2021
- April 2021
- March 2021
- September 2020
- August 2020
- June 2020
- April 2020
- March 2020
- January 2020
- December 2018
- June 2018
- March 2018
- February 2018
- January 2018
- September 2017
- September 2017 Post-Hurricane
- June 2017
- March 2017
- January 2017
- September 2016
- March 2016
- December 2015
- September 2015
- June 2015
- March 2015
- December 2014
- June 2014
- March 2014
- November 2013
- September 2013
Three Months of New Jobs Data for Houston Confirm Slowdown, Paint Slightly Better Picture for Economy
November 25, 2013
The shutdown of the federal government in early October delayed the release of September payroll employment and unemployment data for Houston until November 22, the regular release date for October figures. Counting the revision of August data that should have occurred in September, this latest news gives us insight into the last three months of local job growth. The new numbers confirm the slowdown already apparent in Houston’s job growth since mid-year, but also paint a slightly more optimistic picture of recent growth than earlier data.
Houston's payroll employment growth remains strong. (Figure 1) The prior data through August indicated that job growth had slowed on a year-to-date basis to an annualized 2.8 percent; the latest figures are 3.2 percent through October, a rate that would deliver well over 80,000 jobs if it continued through December. Both figures are excellent – well above Houston’s average of 2.2 percent annual growth since 1990 – and discussion of slower growth must be kept in this context. The slowing is from a beginning point of 4.0 percent job growth in 2012 and over 100,000 new payroll jobs.
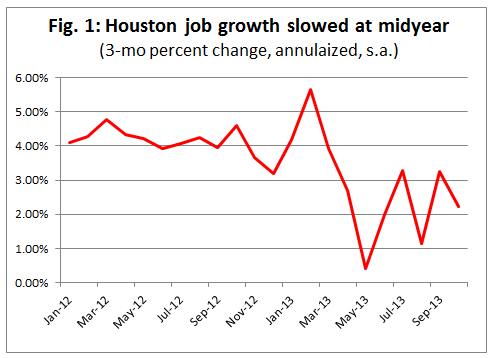
There is good reason to be cautious about interpreting small changes in the data. First, strength has varied within the year, running four to six percent early in 2013, but averaging 2.7 percent during the last six months. Further, the most recent estimates from the Texas Workforce Commission have followed an erratic path, even when seasonally adjusted and smoothed with a three month average as in Figure 1. This suggests that the Commission may be struggling with the current estimates, and we could see significant revisions in coming months. For this reason, our forecast of local job growth remains near 75,000 for 2013.
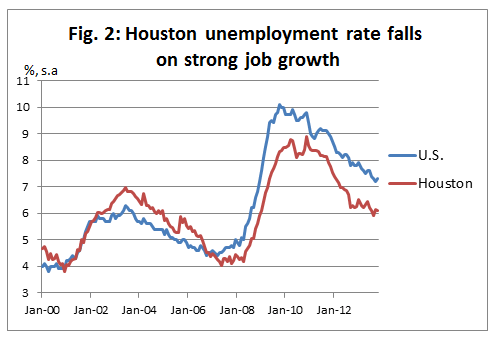
The Houston unemployment rate tells much the same story. Figure 2 shows that Houston’s unemployment rate had been dropping faster than the U.S. since late 2010, but the trend was broken in 2012. Houston’s unemployment rate has been stagnant near 6 percent since last June, and the new data simply confirmed the pattern.
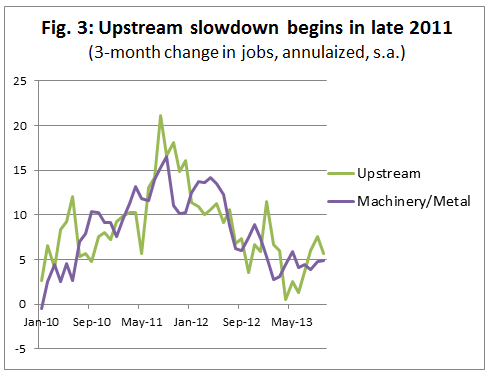
Why slower job growth? The primary cause is almost certainly the collapse of natural gas prices in late 2011, which led to 560 rigs being pulled away from natural gas directed drilling and a 2012 drop in the domestic rig count of over 12 percent. Figure 3 shows the rate of growth of jobs in Houston upstream sector (both producers and services) and in closely-related machinery and fabricated metal. Together, these sectors account for over 225,000 of the best-paid jobs for Houston. Both were growing at annualized rates of 15 to 20 percent in 2011, but have now settled in at about 5 percent. For the next 24 months a pick-up in this growth rate much above 5 percent seems unlikely.
In summary, the new data confirm a shift to slower but healthy growth in Houston. The data through October are slightly more optimistic about the extent of the slowdown, but the erratic month-to-month pattern of recent estimates raises questions about the durability of this interpretation. For now, we will stick with our forecast of 75,000 jobs for Houston in 2013 and 65,000 in 2014.
Written by: Dr. Robert W. “Bill” Gilmer
Director, Institute for Regional Forecasting
November 25, 2013