Houston Updates
-
Archive
- December 10, 2024
- September 14, 2024
- May 21, 2024
- March 19, 2024
- December 9, 2023
- June 16, 2023
- April 6, 2023
- March 17, 2023
- Dec. 19, 2022
- Sept. 14, 2022
- July 4, 2022
- March 27, 2022
- March 9, 2022
- September 2021
- April 2021
- March 2021
- September 2020
- August 2020
- June 2020
- April 2020
- March 2020
- January 2020
- December 2018
- June 2018
- March 2018
- February 2018
- January 2018
- September 2017
- September 2017 Post-Hurricane
- June 2017
- March 2017
- January 2017
- September 2016
- March 2016
- December 2015
- September 2015
- June 2015
- March 2015
- December 2014
- June 2014
- March 2014
- November 2013
- September 2013
The Economic Outlook for Houston:
Cyclical Fundamentals Return As the Pandemic Ends
September 27, 2023
Economic growth in Houston today depends on two big themes: first, the current cyclical background tied primarily to prospects for the US economy, and second, recent economic history including three rounds of recent oil-industry downturn and the on-going recovery from the pandemic and pandemic-era policy errors.
Today, the Houston economy is probably driven 70% by the US economy, 20% by oil, and 10% by the Texas Growth Formula (TGF). The TGF is growth advantages given Texas through lower taxes, less regulation, and a younger labor force. Ten years ago. I would have told you that the cyclical mix was not 70/20/10 but 60/30/10 with oil taking a bigger role. Change came on three rounds of oil industry downturn and bankruptcy that left the oil industry and Houston’s business cycle permanently changed, now smaller, slower growing and more stable than in the past.
By most measures of economic recovery, the pandemic downturn is over. Houston, for example, saw a return to pre-pandemic levels of employment in April 2022 and the US recovered just two months later. Both have continued to grow after the return of pandemic losses, with Houston adding another 125,400 jobs. If the combination of five trillion dollars in stimulus and zero interest rates brought pandemic recovery, they also triggered in 2021 a sharp and on-going outbreak of inflation. The Fed reacted late to the spike in inflation but in early 2022 began to quickly raise its policy rate from zero to 5.25 percent.
So far, 70 percent of the US economy defined by the consumer and propped up by high levels of savings from stimulus money, has been able to stave off the negative impacts of much higher interest rates on the broader economy. Economic indicators remain mixed on how soon the consumer will run out of pandemic cash and how soon the economy will slow. But the slowdown is inevitable and defines the biggest part of the current cyclical outlook for Houston.
The US Economic Outlook
For the short-run US forecast we rely on the Survey of Professional Forecasters. The SPF is the oldest quarterly survey of US economic forecasts. It was compiled and published by the NBER from 1960 to 1990, when the Federal Reserve Bank of Philadelphia was asked to take it over. Its results are published quarterly on the Philadelphia Fed website.
Participation in the survey is geared (for better or worse) to 35-40 professional macroeconomic forecasting groups in academics, consulting, banking, and industry. Compare this to the general survey of National Association of Business Economics membership who may or may not be forecasters or to the heavy financial-sector participation of the Wall Street Journal’s outlook survey.
Despite the Fed’s recent efforts at raising rates, the SPF has not forecast a recession in response to this round of tighter monetary policy. Figure 1 shows the results of the Survey over the last year for gross domestic product (GDP), the broadest measure of the economy. Forecast results are shown for five quarters, allowing us to compare last August (and the forecast used for this same outlook last fall) to the latest SPF forecast available. We saw a moderately strong economy last August, an economy that was assumed to weaken over the last year, but now a return to more economic strength in the latest outlook. This looks more and more like the Fed’s soft-landing with a cyclical slowdown but no recession.

The variable we rely on most heavily for the Houston forecast is US payroll employment. Regional economic data is limited compared to the wide-ranging and detailed data available for the US. Only annual GDP and personal income figures are published for Houston, for example. Payroll employment provides the best and richest data set available on major metro areas like Houston.
Figure 2 mimics Figure 1, except now substituting payroll employment. A typical number of monthly US jobs over the dozen years leading up to the pandemic was about 125,000. Like GDP, job growth had already weakened in August of last year, weakened further in following quarters, but then strengthened again this summer. Even with improvement built into the current outlook, coming quarters see subpar economic performance, below trend job growth, but no recession in sight.

The most striking feature of these recent outlooks, however, is the persistence of job growth at quite high levels throughout the last year. And the persistence of the SPF membership in wrongly forecasting a sharp slowdown in the face of sustained and outsized job-growth numbers. This continued consumer strength is witness to the size of the stock of accumulated cash during the pandemic. This time the forecasters may be right, however. The US economy has already weakened on a number of fronts. Both US and Houston manufacturing fell into recession in mid-2022 and the wholesale trade sector quickly followed. Even quicker declines came from interest-sensitive sectors like single- and multi-family housing, commercial real estate, and banking. Below, we will see how consumer savings are now dwindling and employment slowing.
The End of COVID Stimulus … And How the Consumer Keeps Spending
The COVID pandemic is over, but the consequences of the policy measures taken to fight it remain central to the US outlook. The key economic problem in today’s economy is inflation, with the CPI breaking out of its two-percent range in March 2021, following closely on the heels of the second and third rounds of fiscal stimulus. Year-over-year headline CPI inflation reached 8.6 percent by June 2022.
But the fiscal payments simply planted the seeds for coming inflation, while the Federal Reserve carefully nurtured this garden with interest rates held too low and for too long. Zero interest rates were maintained through 2021 while the Fed attributed the early inflation breakout to supply-chain issues. A tremendous financial boom ensued through 2020-21 that used this environment to add as much as $15 trillion to household balance sheets before the Fed reacted and began to tighten monetary policy in 2022.
The fiscal stimulus came in two waves of $2.5 trillion dollars each, first in early 2020 during the lockdowns, then followed by two smaller rounds in late 2020 and early 2021 that together totaled another $2.5 trillion. Two and a half trillion dollars was about $16,800 per US household in 2020, and each round saw perhaps half of that cash flow to individuals directly or indirectly -- but quickly and as needed. Most went into the bank accounts of individuals and businesses through economic impact payments, the paycheck protection program, and enhanced unemployment checks.
In Figure 3, the solid blue line shows the pandemic-period track of total personal income (including stimulus), and the solid red line is the wages, salaries, and income of the self-employed (no stimulus). Each point compares these measures to pre-pandemic levels in February 2020. The initial round of stimulus came against a backdrop of consumer shock and lockdowns, along with a ten percent drop in wages and salaries that was immediately matched by a ten percent jump in stimulus-driven personal income. These cash payments appeared to quickly right the economic ship by mid-2020 by offsetting wage losses and delivering record levels of income. Pre-pandemic levels of wages and salaries were fully restored by November 2020.

Figure 2 also shows us an economy that is now expanding on its own. The red line for wages and salaries has been growing rapidly since late 2020 and now stands 19.1 percent above pre-COVID levels. The blue personal income line has slowed as the stimulus recedes, although it is now being carried forward nicely by wages and salary growth at 18.2 percent above pre-COVID levels. However, the gains are much less impressive if inflation is removed as shown by the broken lines. Personal income is then up only 4.3 percent over three-plus years and wages and salaries up only 5.3 percent, or at annual rates of 1.5 and 1.6 percent per year since the lockdowns.
After the impact payments had been sent out to individuals, the major features of pandemic spending were the paycheck protection program and enhanced unemployment compensation. In April 2021, these programs were running at annualized rates of $763 billion, but by January 2022 all of the major programs were rapidly winding down and had largely ended.
How do spending and allocations stay high with stimulus payments now ended? A key part of the story for consumers was that the pandemic stimulus was not all spent, and much was saved. “Savings” as defined by the National Income and Product Accounts is simply the difference between after-tax personal income and outlays on goods and services. Using 8.9 percent of after-tax income as a decades-long average of past consumer savings rates, Figure 4 shows that actual savings rates were far higher than normal throughout much of the pandemic. The savings rate finally slipped below 8.9 percent throughout last year and has since fallen to low levels near three percent.

The right side of Figure 3 shows that these pandemic-period savings cumulated into a huge amount of cash, with “excess” savings above the 8.9% mark reaching $2.5 trillion in September of 2021, and are still hovering around $600 billion this August. They are now shrinking at a rate of $100 billion per month .
You must be careful with the definition of savings, however, as well as the rough calculations used here. It includes any part of after-tax income that is not spent on goods and services, and the simple identity between savings and investments suggest the myriad ways for “savings” to be spent on assets in place of goods. New homes, existing homes, or consumer durables would be in this definition of savings turned into investment, along with financial assets like stocks and bonds.
Stocks and bonds might be relatively liquid, or they might have gone to a 401(k) where they are subject to penalty withdrawals, or maybe they were just lost to the current financial downturn, or to meme stocks, crypto, or other regrettable investments. While much of this saving goes to illiquid assets, the liquid component held by households remains quite large, and the amount is important because it is the dry powder that drives consumer spending.
The US Economy Still Propped Up by the Consumer
The clearest signs of any emerging problem in the US economy have come so far in those sectors most sensitive to interest rates, particularly single- and multi-family housing, commercial real estate, and banking. More generally, the National Bureau of Economic Research is the semi-official referee of whether the US economy is in recession, and Figure 5 lists the four key measures it uses to determine this: manufacturing, trade, income, spending, and employment.

The manufacturing sector is in recession, with the manufacturing part of the index of industrial production peaking in October 2022, declining briefly, and then turning flat in recent months. The US manufacturing index published by the Institute for Supply Management shows the sector to be in contraction for the last nine months with conditions no longer worsening. Real wholesale trade followed manufacturing into decline after peaking as soon as the Fed began to raise interest rates. Sales have now fallen 4.7 percent but are now stable.
All of our other measures are geared to the roughly 70 percent of US growth driven by the consumer: real retail sales, personal income, consumption, and employment. Once a picture of consummate strength based on all these measures, the consumer looks increasingly like a high-wire act, just holding steady or growing slowly from high levels. Employment in recent months had remained the strongest of this consumer grouping but has recently slowed sharply back to trend. Adding over 300,000 jobs per month early in the year, Figure 6 shows a trend below 150,000 per month and falling.

Retail sales in Figure 7 illustrate the household’s continuing high-wire act, with the chart showing US retail sales in billions of dollars per month. The first round of stimulus in 2020 quickly pulled sales that had collapsed in the lockdowns back to pre-pandemic levels, but the second and third rounds again pushed sales up sharply and past record levels by another 67.7 billion per month or by 12.4%.
The blue line in Figure 7 is not adjusted for inflation and shows continued rapid retail growth in nominal dollars, while the red line is adjusted for inflation and shows no meaningful spending growth over the last two years. However, this says that real-dollar retail sales have moved sideways after a 12.4 percent jump, and the consumer is still spending at high levels after additional stimulus evaporated 20 months earlier. And this is despite very slow real personal income growth at only a 1.1 percent annual rate.

The Federal Reserve Still Has Work to Do
The recent outbreak of inflation began in earnest in early 2021. After 15 years of the Federal Reserve not being able to push inflation high enough to meet its 2.0 percent price target, just 15 months later CPI inflation was peaking at 8.6 percent based on 12-month annual changes. (Figure 8) Rising oil and food prices following Russia’s invasion of Ukraine contributed strongly both to the CPI peak and the recent fall to 3.2 percent. On the basis of 3-month changes, the CPI has recently been running in recent months as low as 2.0 percent, but recently jumped to 3.9 percent on the back of sharp increases in the price of oil.

For policy purposes, however, the Federal Reserve uses another measure of price change and inflation. It turns to the personal consumption expenditure (PCE) deflator from the national income accounts, with a methodology more trustworthy than the CPI. Alan Greenspan -- and many others -- have called the CPI a “deeply flawed” measure of price change. Further, the Fed excludes volatile oil and food prices from its price calculations because oil markets and crop failure are well out of the Fed’s span of control.
Figure 9 shows the core PCE at work. Like the CPI, for 15 years it failed to meet the two percent Fed target, and the PCE breakout and inflation peak were timed much like the CPI. However, the Fed’s core PCE saw prices rise to only 5.4 percent peak or 3.2 percent below the CPI peak. While these lower prices are of little comfort to the consumer who lives with the reality of recent food and gasoline inflation, this is the measure the Fed watches closely for purposes of steering monetary policy.

Progress has been slow in bringing down prices as measured by the core PCE. Based on the 12-month changes in the left side of Figure 9, prices have fallen from the 5.2 percent peak to 4.1 percent. However, using 3-month changes (right side), the August data now show a fall to an annualized decline to 2.9 percent. This progress all comes this summer, with these 3-month changes still at 3.7 percent this past May. But it is a promising short-term trend that we hope continues to hold.
Can the Fed break the back of consumer spending, slow the economy, and bring inflation down? They certainly have the tools, and the only question is whether they have the political will. They tried a timid campaign to restore a positive policy rate from 2016-2019, slowly raising rates from 0.5 to 2.5 percent, but then quickly cutting rates in early 2019 at the first signs of economic weakness. Then came the pandemic, the restoration of zero interest rates, and a decision to hold these rates at the zero bound for far too long.
Embarrassed by this recent record, central bank credibility, personal legacies and professional reputations are at stake. I think the Fed is now prepared to do what is necessary to bring inflation down to a two percent target. Based on current data, this would imply that the Fed will plow ahead with further rate increases until the household sector has clearly cracked and then hold rates high until inflation is definitively broken. They have repeatedly stated this goal and that it will mean no rate cuts in 2023 and perhaps well into 2024. If the Fed chooses, controlling inflation should be a matter of when … not if.
However, the markets apparently don’t believe the Fed’s scenario. While they accept the economy may soon weaken, they also think that at the first sign of weakness the Fed will quickly back off and begin cutting rates.
The chart in Figure 10 is a market-based Atlanta Fed forecast of the federal funds rate using the COMEX futures market and international swaps, and it reflects the market’s doubts about Fed conviction. First, note that expectations are for a series of rate cuts beginning in early 2024 and continuing, running counter to the Fed’s public statements. Second, note that through 2025 the forecast policy rate remains high, ending the year near 3.7 percent. At the same time, the Fed’s internal estimates of its long-term real interest rate is 0.7-0.9%, and the market’s 3.7 percent implies inflation still running near 3.0 percent. This is well above the Fed’s internal projection of inflation at 2.0%-2.4%. Again, it shows doubts about the Fed’s ability – or willingness -- to what is necessary to get inflation down to 2.0 percent.

The Big Picture of Houston’s COVID Recovery
There is no question that Houston’s payroll employment has produced extraordinary growth in recent years. Its 2019 payroll employment growth was right on a typical trend pace of 58,400 or 1.7 percent. Then came the pandemic and the loss of 192,200 jobs year-over-year, the return of 163,800 in 2021, and finally another 150,400 last year. Once pandemic-era jobs were restored to their prior peak last April, Houston moved into a new economic expansion and has since added another 124,500 jobs.
But we need to be careful in how we interpret these extraordinary job gains. First, any cyclical recovery from a downturn should bring jobs back quickly, as labor and capital have been pushed to the sideline by recession, but as soon as demand returns they are immediately available to return to work. And COVID left many jobs to bring back. Houston’s job return has been right in line with the deep lockdown losses and post-pandemic recovery seen across the nation which, above all, reflects the depth of losses forced by COVID. Recovery always slows sharply to an ordinary cyclical expansion once we must begin the wait for new workers to be trained or new factories to be built.
Houston’s payroll employment losses and recoveries are shown in Figure 11, with a two-month lockdown decline of 363,400 jobs or 11.5 percent. This compares to 21.1 million US jobs lost or 14.4 percent. Houston’s decline was smaller thanks to a less restrictive lockdown policy in Texas, and the stronger initial US recovery was a strong bounce back as heavier COVID sanctions were lifted. However, for the most recent recovery phase, Houston and the US were on virtually the same track.
By April, Houston had added back all of the lockdown losses, plus another 124,500 jobs through this August. The US completed its job recovery two months later in June. Note that since the job recovery last year, Figure 11 shows a broad slowdown in job growth as both the US and Houston curves slowly flatten. Figure 6 already illustrated the details of this US slowdown, and we will see a similar figure for Houston below.

Houston’s Economy Now
The Fed’s efforts to slow the US economy are having much the same effects on Houston as on the US: credit-sensitive sectors responded quickly and negatively to higher interest rates, manufacturing slipped into recession, and local wholesale trade jobs broke a strong growth trend in October 2022. We lack timely data on personal income or consumption in Houston and other metro areas, but local spending is still strong while both Houston and US employment growth has slowed sharply through the first 8 months of this year.
Autos and housing were affected in different ways by the pandemic and responded differently. Autos, for example, struggled to deliver product due to chip and other material shortages, choking supply chains, and making price the major outlet for surging auto demand in 2021 and early 2022. (Figure 12) The big supply kinks have since worked out; auto sales rose through late 2022 and the early part of this year but are now weakening.
Auto and truck prices remain high – still about 25 percent above pre-COVID levels – but with no significant price gains in the last year. Like sales, prices peaked earlier this year and are now falling slowly.

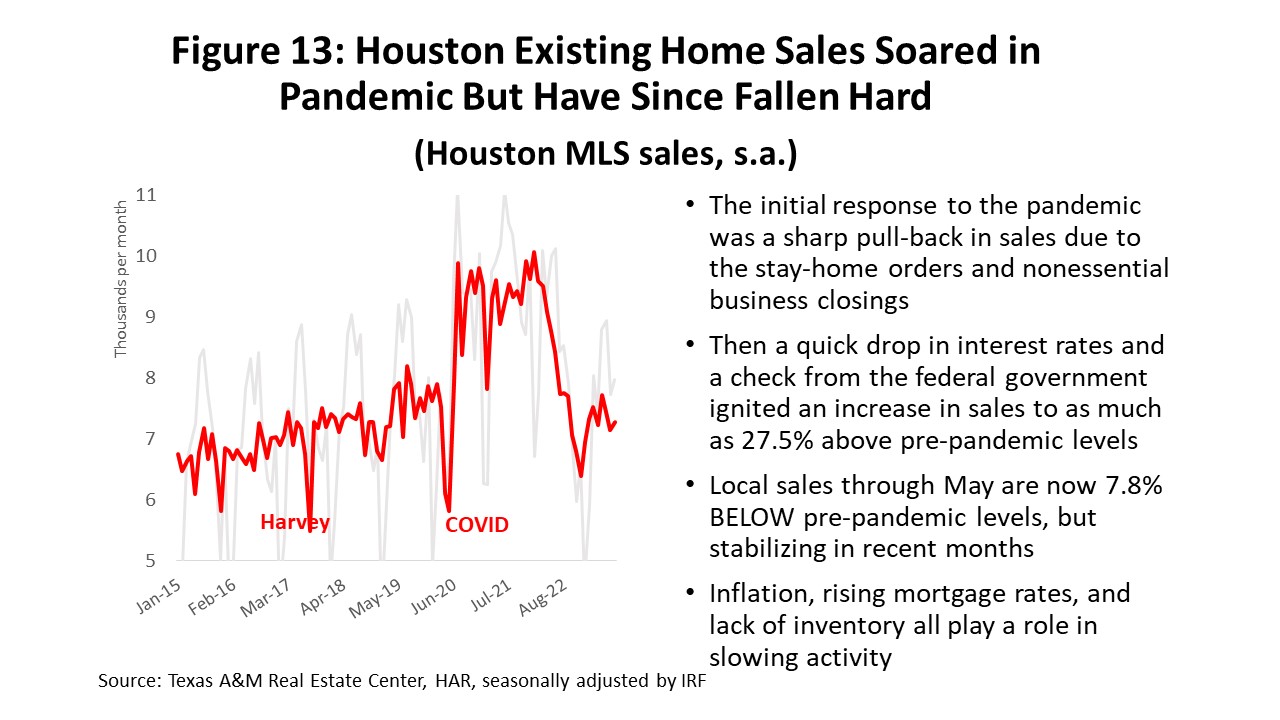
Existing home sales were a local pandemic bubble that burst once mortgage rates began to rise. (Figure 13) Existing home sales in Houston fell hard during lockdown months but recovered quickly with a check from the federal government and zero interest rates. Housing became a major element of the 2021 financial boom. Sales in Houston rose as much as 27.5 percent above pre-pandemic levels, only to fall hard when the Fed raised interest rates in March 2022. They then fell back as far 19.0 percent below pre-pandemic levels and have since recovered only to 7.8 percent below.
Existing home prices surged from $252,600 for the typical unit to $344,780 during the boom period, or by 36.5 percent. So far, sharply falling sales have pulled prices back by only 3.0%, and history says prices could hang to a big part of these gains in years to come. However, such an outcome would likely mean a decade or more of small or limited home price appreciation.
Manufacturing across Texas made a strong pandemic recovery in 2020-21 according to the Dallas Fed but a long and persistent slowdown set in shortly after the first Fed rate hikes. The first negative result for the sector was registered in February of this year followed by brief improvement, but the last four months through August have seen steady contraction.
The overall Houston Purchasing Managers Index declined steadily for the last year and now stands at 52.1 in August, indicating slow, but positive growth for the overall economy. Houston’s manufacturing PMI hit its first negative value last September and finally slipped into strong contraction in April.
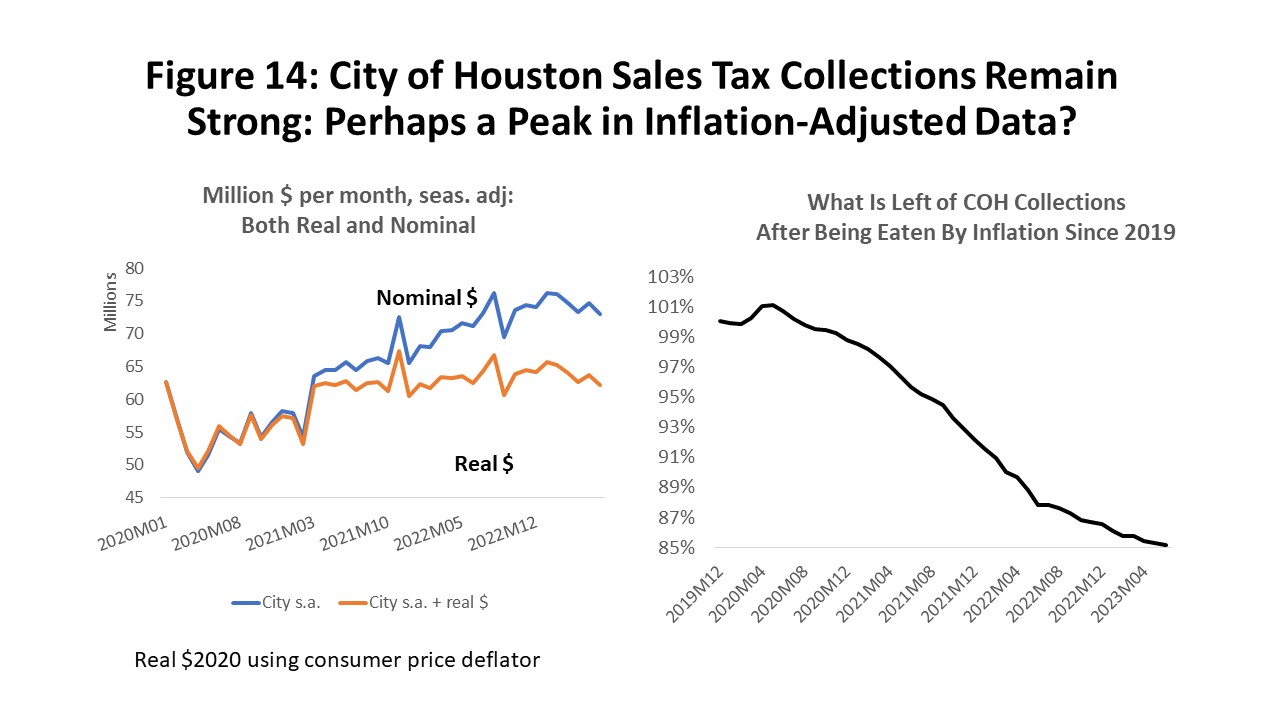
For Houston and other metropolitan areas, we do not get timely data on personal income or consumption, but spending data is available. The City of Houston sales tax revenue provide a good window into these results. If you look back at Figure 7 on US retail sales, you can compare them to City sales tax collections in Figure 14, and in many ways, they are a mirror image of each other. With the early 2021 stimulus payments we see a jump in City sales tax collections of at least $5.0 million per month or the equivalent of an additional $500 million dollars in local taxable sales.
Even adjusted for inflation, these revenues have not yielded much ground to the 8.8% surge above pre-pandemic levels. Like the US, high levels of local consumer spending have been an essential prop to keep the economy running at high levels after the stimulus ended in early 2022. A trend to slower spending may be setting in, but we would certainly need to see a more definitive drop in the trend before drawing that conclusion.
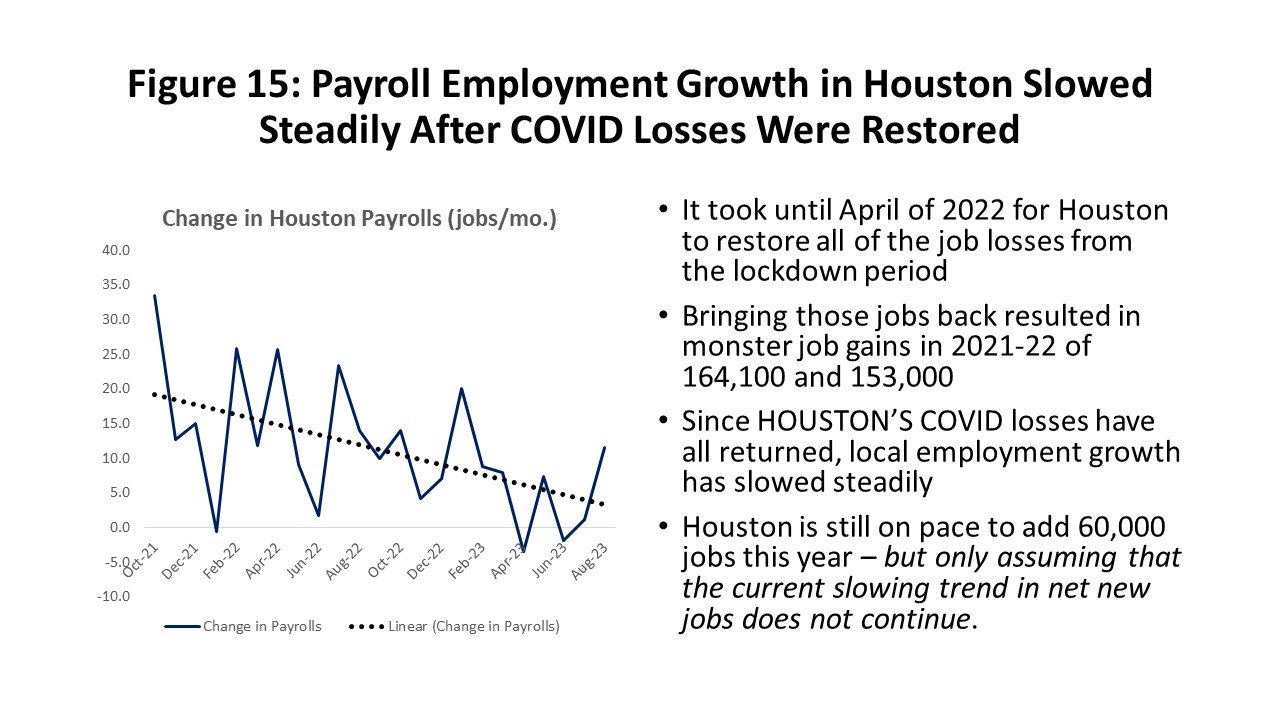
Both Houston and the US recovered their massive COVID payroll job losses on virtually the same schedule, and both have slowed in just the last quarter to match pre-COVID growth trends. The Fed is looking for a return to normal household conditions, and this payroll employment slowdown is a very important signal. Figure 6 earlier showed the US performance and Houston’s Figure 15 closely matches it. Follow the broken-line trend and Houston jobs moved under 5,000 jobs per month in June. This monthly 5,000 jobs is 60,000 per year, or close to Houston’s current long-term trend rate of job growth. The recent US job growth also has entered a final post-COVID slowdown and has moved back to monthly long-term trends near 125,000 per month.
Houston Oil: Smaller, Cautious, More Stable
We have stressed in recent reports that the future economic impact of oil on Houston will be smaller but more stable. The fracking industry has accepted that it is a high-cost source of oil and that it can no longer rely on sustained high oil prices and rising equity values as a means to attract investors and finance oil-field activity. Instead, it has become a value stock committed to using 30-40 percent of operational cash flow to draw investors. This means substantially less oil-field activity at every oil price than would previously have been expected.
Understanding the new framework for US fracking is made more pressing by a likely return of much higher oil prices. Led by the Russians and Saudis, OPEC+ now seems prepared to push oil prices up sharply again. Prices have held at between $70 and $80 per barrel since late 2021 and this current push could see $100 per barrel or higher.
The new financial model began to be widely adopted after the Russia/Saudi “Oil War” that was concurrent with the pandemic lockdowns in March 2020. Today an oil price of $100/b is not the same as $100 in 2019. It means less to the oil consumer in the sense that general inflation has taken a substantial bite out of that $100. If we compare a $100 price in mid-2019 to $100 today, the GDP price deflator shows a 15.9% jump in the cost of living or an inflation-adjusted oil price of $86.28 today. Oil prices that are higher today than yesterday are always painful, but the $100 label is misleading.
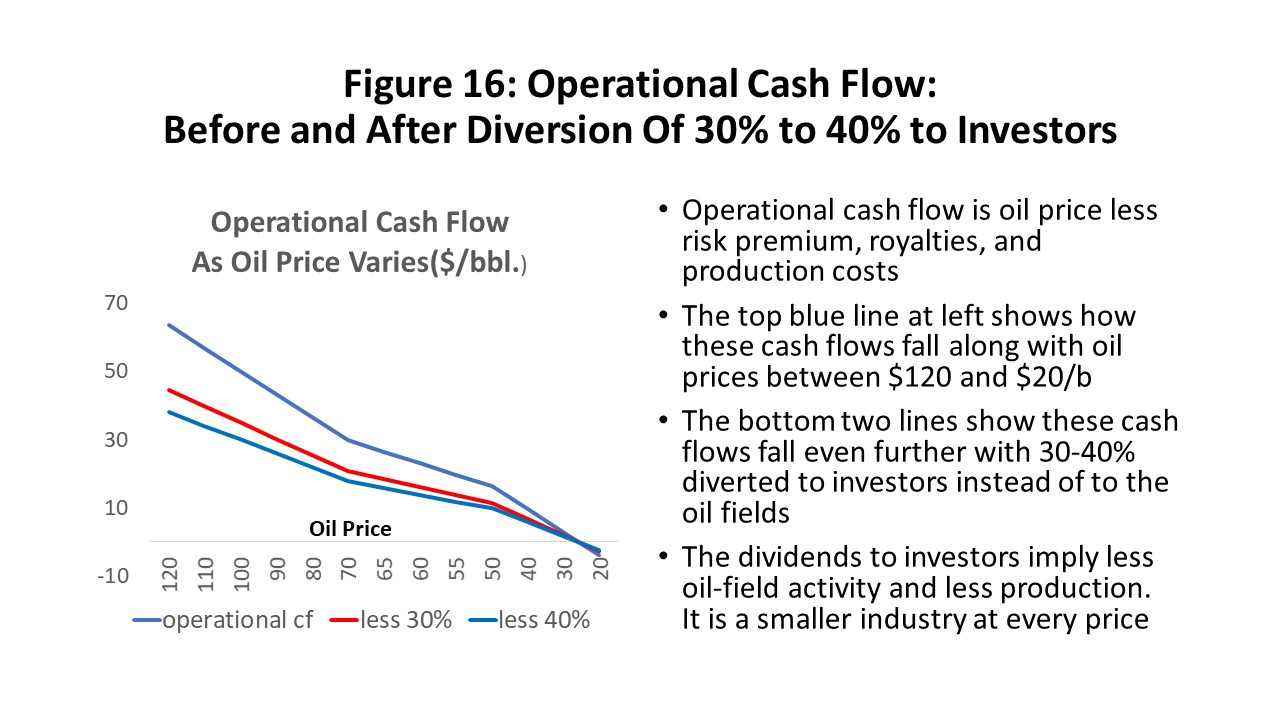
The second sense in which an oil price of $100 is different is that – even adjusted for inflation – the immediate diversion of 30-40% of operational cash to the investor means less activity in the domestic oil fields. Operational cash flows are oil price less a risk premium of about 12.5 percent, royalties of 20%, and lifting costs of $15 per barrel adjusted for oil-field cost inflation since 2019.
The top blue line in Figure 16 shows these operational flows, and under the 2019 growth model most of this cash was diverted to the oil fields. Since 2019, large public companies have adopted the new financial model and divert 30-40% of this operational cash to investors. The two bottom lines in the figure show flows into the oil fields under the new model for 30 and 40 percent. At the $100 oil price, for example, $50.00 per barrel flowed to the oil fields in 2019, and today only $30-$35. For a $65 oil price, $26.40 previously went to the oil fields and today only $15.80-$18.40.
This new financial model for the fracking industry comes with other rules beyond maintaining a pristine balance sheet and rewarding investors with substantial dividends. The US producer has to remember that they need oil prices at $55-$65 to profitably produce oil, but they should never get sucked into another round of high levels of drilling and production based on high prices like $100 oil. That would be the formula for yet another round of bankruptcy for the industry. Finally, they know well that OPEC holds the whip, investors are watching, and they should never increase production sharply if oil demand is weak or OPEC holds excess oil reserves.
One loose analogy to producer behavior as they move through the oil-price cycle is that they now are treating their balance sheet as a rainy-day fund. In place of pouring their cash into higher levels of drilling activity every time the price of oil rises, they use part of it to fortify their balance sheet and reward investors. Then they can better meet low oil prices based on accumulated financial strength.
Figure 17 summarizes the new rules of the road, and the chart shows US production that has only recently returned to pre-pandemic levels. The producers now run companies smaller than under the old growth model but all benefit from the greater oil-cycle stability; the larger Houston economy similarly sees less growth but greater cyclical stability. The loser to the new financial model is the US and global consumer facing higher oil prices. The biggest winner, however, is OPEC+ enjoying higher prices and US production growth that has been tamed compared to the pre-2019 era of fracking boom and bust.

Oil Prices and Oil-Field Activity
Oil prices increased to $70/b by late 2021, drawing strength throughout the post-pandemic era with its rapidly improving economy, stronger travel demand, and increased power generation. OPEC first intervened in 2022 to cut production in the face of what they claimed was a weakening global economy. There are currently 2.0 million barrels per day of cuts underway within the official OPEC framework and another 1.3 million of “voluntary cuts” by Saudi Arabia and Russia. Their main effect has been higher oil prices which recently reached $90/b for WTI.
These cuts leave excess production capacity within OPEC at 5.7 million barrels per day, adequate for emergency use or to expand crude supplies. The US production response has been tepid – as expected – adding only another 1.5 million barrels per day in recent months and accounting for most of the global increase. US production finally returned to pre-COVID levels in recent months.
There has not been a rush back to the oil fields after COVID. (Figure 18) An oil-industry credit crunch in 2019 -- led by and forced by OPEC -- finally proved to US producers that they were a high-cost source of oil. It pushed the rig count down to nearly 760 before COVID arrived, and then rigs fell hard to an all-time low of 253. Recovery saw a return to 780 before beginning to fall yet again, now down by about 18 percent this year. Frac spreads are the more modern measure of activity in the oil fields, but they tell much the same story and are down about 15 percent this year.

This decline in rigs and frac spreads has less to do with oil price than rising interest rates. For large public companies, these new financial rules are firmly in place with strict capital discipline and investors getting paid first. However, these large companies are also driving big gains in productivity in fracking, holding onto rigs, and accounting for most of the recent production increases.
The laggards are small private companies that don’t use the new model. Often relying on bank financing, they are now struggling with higher interest rates, lower-quality acreage, and an inability to capture productivity gains. They are shedding rigs, reducing drilling, and account for most current reverses. Cost escalation has stopped in the oil-fields, but high cost levels remain challenging for labor and supplies.
Oil-related employment in Houston has behaved much the same way as the rig count – slower and lower despite healthy oil prices. (Figure 19) After losing 42,300 upstream oil jobs to the credit crunch, COVID pandemic, and Saudi/Russian oil war, the return of these jobs continues at a slow pace. Only 20,500 oil jobs are back or 47.4 percent. If we begin counting from the end of the fracking boom in 2014, Houston has lost over nearly 80,000 jobs in oil production, services, fabricated metal, and machinery. Again, just one more sign that this is a cautious industry – smaller and slower-growing.

Houston’s Employment Outlook
With COVID behind us, 2023 has seen economic fundamentals return to the driver’s seat as oil and the US economy take control. Strong signs are emerging that the policy hangover from past fiscal and monetary stimulus is disappearing. While local payroll employment best shows this hangover coming to its end, consumer spending still hangs on at high levels. (Figure 20)
To pull the forecast together, we use a high, medium, and low outlook for planning purposes. We use the price of oil as the vehicle to spread the outlook from low to high employment levels. For current planning, the low oil price is set near $40 per barrel and the high at $80. The medium price is $65 per barrel or the long-run marginal cost of oil. In all cases, we use the new financial model with 30 percent of operational cash flow diverted to investors or else used to strengthen the firm’s finances. This smaller and slower-growing oil industry reduces our expectations for oil-field expansion and now implies slower regional growth than similar prices would have implied in the past.
Current speculation holds that OPEC+ is beginning a push toward $100/b for crude, with plans to hold high prices for a prolonged period of time, and this returns $100/b to the realm of possibilities. We have kept the high employment forecast near $80 per barrel but added the impact of a $100 oil price to demonstrate its consequences. Always a past marker for an oil-field boom, today’s $100 oil will not bring back the frenzied domestic oil-field activity of the past.

We follow the lead of the Survey of Professional Forecasters in assuming a slowdown in US payroll employment growth from 168,600 jobs per month in 2023Q2, falling to 103,700 in Q3, followed by several quarters of growth below 80,000 jobs per month through 2024. This compares to the roughly 125,000 jobs per month during the 12-years of recession and expansion from December 2007 and leading up to the pandemic. There is no US recession in the outlook -- just a prolonged slowdown of six quarters -- and growth that picks up quickly and moves above trend by the middle of 2025.
Figure 20 also shows how these economic fundamentals play out over the long run for Houston payrolls in the low, medium, high, and $100 cases. This is our forecast of Houston’s economic future through calendar year 2028. We see the COVID lockdowns end, a long recovery to pre-pandemic employment levels and beyond, a sharp slowdown that comes in late 2023, and 2024 as a full year of slow growth. For Houston, growth through 2023 and 2024 average about half of Houston’s long-run annual trend of 58,000 jobs. We bounce back well above trend in 2025 before reverting to the long-run trend.
Figure 21 is this same 2023-2028 forecast of Houston’s payroll employment stated in annual changes and measured Q4 over Q4 each year. The near-term focus of the outlook should be between the medium and high forecasts as long as oil averages between $70 and $80 per barrel as it has done for the last 18 months. If oil prices continue to hold in this $70 to $80 range, we could see around 40,000 jobs in both 2023 and 2024. While not a recession, it will feel painful after the high rate of growth following the pandemic.
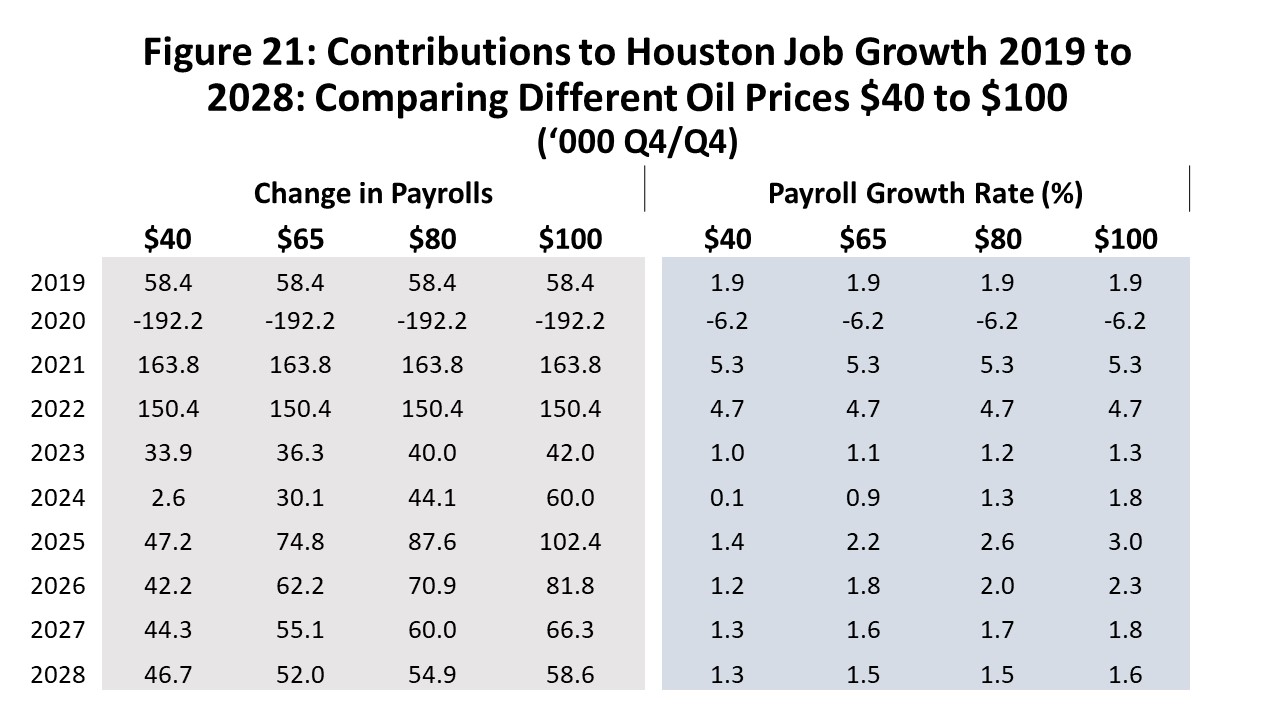
Oil prices in 2025 (and after) revert to a long-term mean near $65 for oil and US payroll employment to a trend 125,000 jobs per month. In 2025, we expect a bounce back in the local economy to 74,800 jobs, followed by a slow return to long-term trends with 62,200 in 2026 and a 55,100 in 2027. The 2025 bounce is typical after any slowdown or recession, as trained workers and factories are in place and waiting to return to work.
Note that $100 oil would briefly see a big year for Houston in the 2025 recovery period with 102,400 jobs. However, this promptly fades to a longer-term mean near 70,000 local jobs. Contrast this to the final three years of the fracking boom, for example, that saw Houston average 107,600 new jobs through consecutive years.
Written by:
Robert W. “Bill” Gilmer, Ph.D.